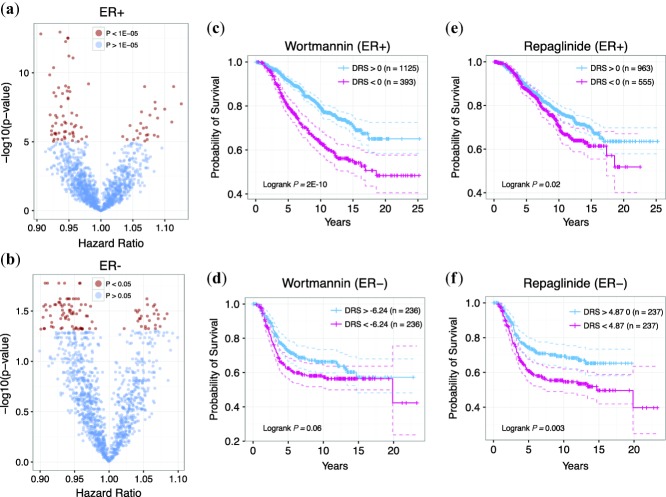
Figure 6.
Drug candidates for ER+ and ER– patients. (a) P-value and hazard ratio distribution for all drugs for ER+ patients. (b) P-value and hazard ratio distribution for all drugs for ER– patients. Red points indicate drugs with P < 1E-5 and blue points indicate drugs with P > 1E-5. (c) Kaplan-Meier curves of patients with and for wortmannin for ER+ patients. (d) Kaplan-Meier curves of patients with and for wortmannin for ER– patients. (e) Kaplan-Meier curves of patients with and for repaglinide for ER+ patients. (f) Kaplan-Meier curves of patients with and for wortmannin for ER– patients. For ER– patients, stratifying patients at yields disproportionate sample sizes; therefore, the median DRS was used instead.

