Figure 2.
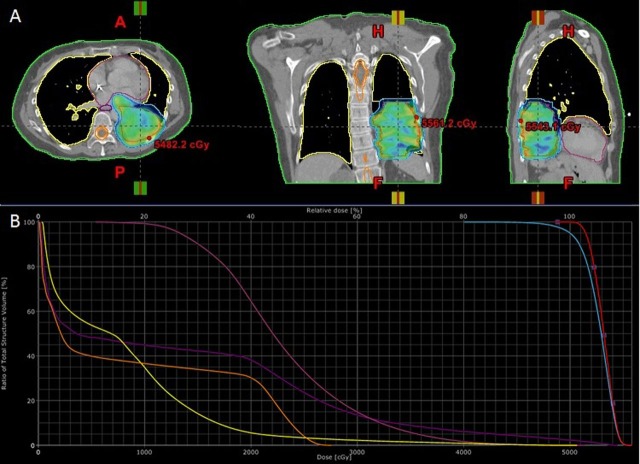
Intensity-modulated radiation treatment plan. (A) Dose-wash images showing dose to intra-atrial lesion in three planes. (B) Dose–volume histogram showing dose to various structures (orange, spinal cord; yellow, total lung; deep purple, oesophagus; magenta, heart). See table 1 for additional dosimetric parameters.

