
Figure 3.
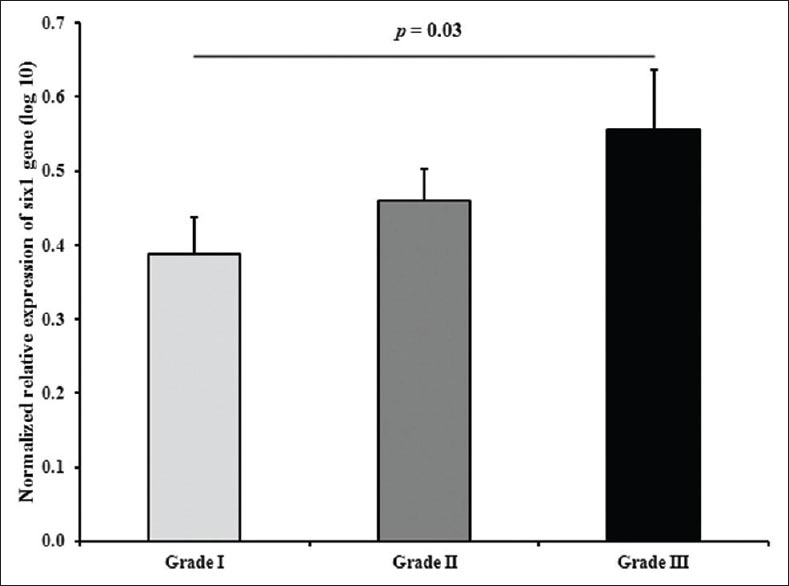
The SIX1 relative expression stratified according to different tumor grades. The difference between grades I and III was statistically significant (P = 0.03)
Official websites use .gov
A
.gov website belongs to an official
government organization in the United States.
Secure .gov websites use HTTPS
A lock (
) or https:// means you've safely
connected to the .gov website. Share sensitive
information only on official, secure websites.
The SIX1 relative expression stratified according to different tumor grades. The difference between grades I and III was statistically significant (P = 0.03)