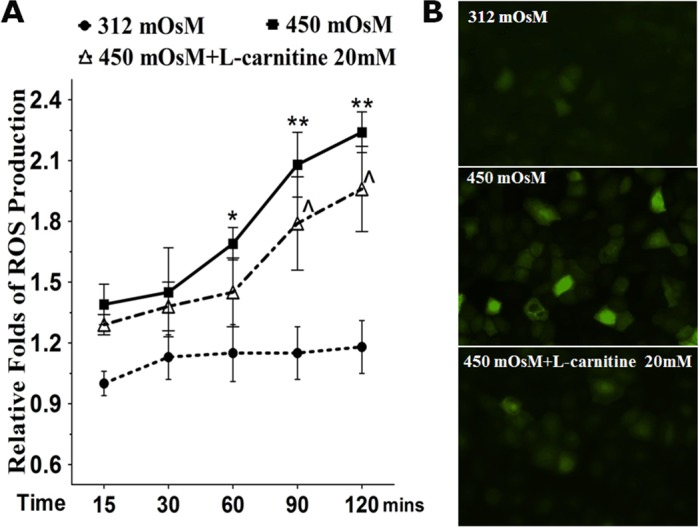
Figure 1.

Production of ROS in primary HCECs exposed to hyperosmotic media without or with L-carnitine. (A) Time course graph displayed the relative fold of ROS production by HCECs in 312 or 450 mOsM medium with or without prior L-carnitine (20 mM) incubation. (B) Representative images showed ROS-DCF fluorescent-positive cells in HCECs exposed to media with 312 or 450 mOsM for 120 minutes. *P < 0.05, **P < 0.01, compared with 312 mOsM; ∧P < 0.05, as compared with 450 mOsM.
