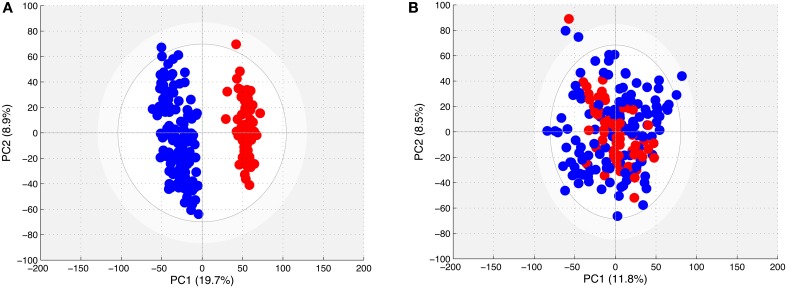
Figure 2.
(A) Score plot of the PCA model computed with all spectra from samples taken from young horses. Each dot corresponds to a spectrum, colored in blue for 2011 and 2013 samples and in red for 2012 samples. (B) Score plot of the PCA model computed with all spectra from samples taken from young horses after removing the effect of year. Each dot corresponds to a spectrum, colored in blue for 2011 and 2013 samples and in red for 2012 samples.

