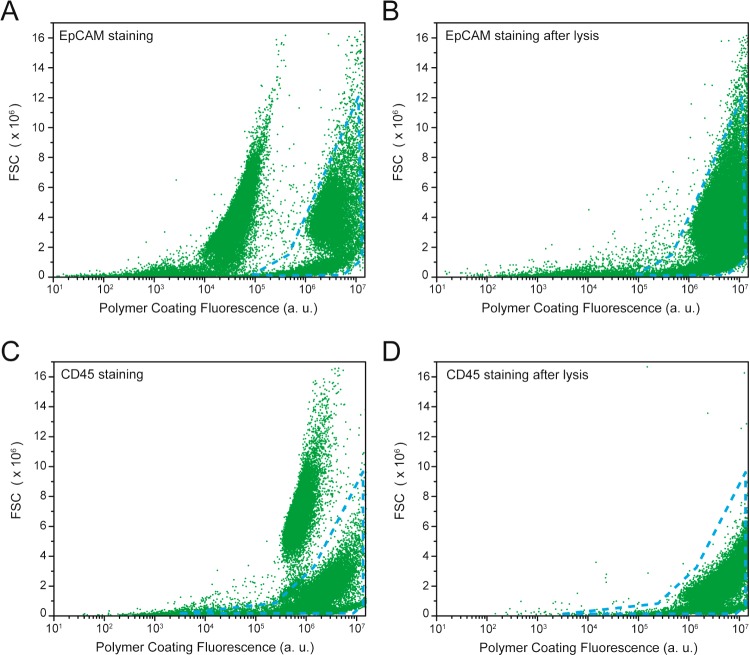
Figure 2.
Specific lysis of cultured cells. Representative flow cytometric analysis of populations before and after exposure to SDS. (A) Coating targeted to EpCAM+ cells from an initial population of 8% A549 and 90% Jurkat after polymerization. (B) Population from A after 5 min exposure to 5% SDS. (C) Coating targeted to CD45+ cells from an initial population of 9% Jurkat and 91% A549 after polymerization. (D) Population from C after 5 min exposure to 5% SDS.

