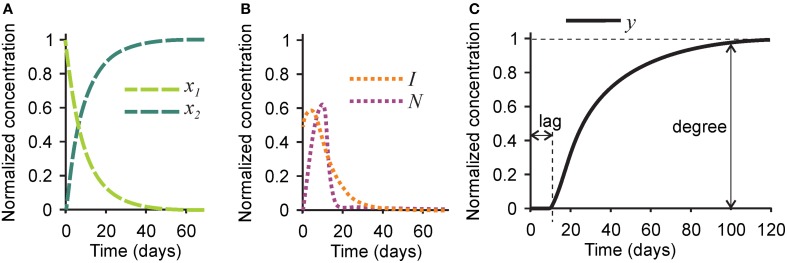
Figure 2.
Changes in time in different players in the mineralization process in healthy bone. (A) The concentrations of naïve (x1, light green) and mature (x2, dark green) collagen matrix. (B) The concentration of the mineralization inhibitor (I, orange) and the nucleation centers (N, purple). (C) The concentration of mineral (y). Indicated are the mineralization lag time, measured as a time delay between time 0 and the onset of mineralization, and mineralization degree, measured as the amount of mineral at time = 100 days. For the simulation of healthy bone, the mineralization lag time is 10 days, and the mineralization degree is 1.

