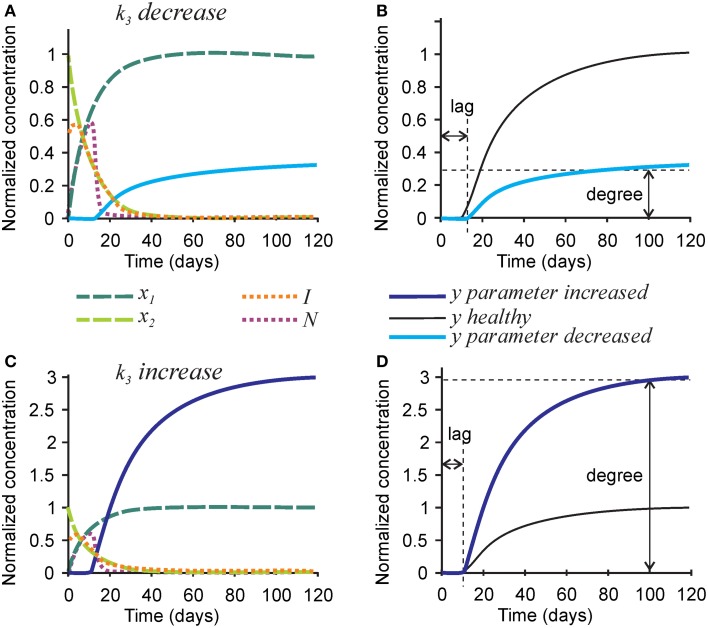
Figure 3.
The effect of parameter affecting formation of hydroxyapatite crystals k3 on the mineralization outcome. (A) The effect of decreasing k3 3-fold. (B) Comparison of the mineralization lag time and degree following decrease in k3 to healthy mineralization. (C) The effect of increasing k3 3-fold. (D) Comparison of the mineralization lag time and degree following increase in k3 to healthy mineralization. The same color scheme is used as in Figure 2.

