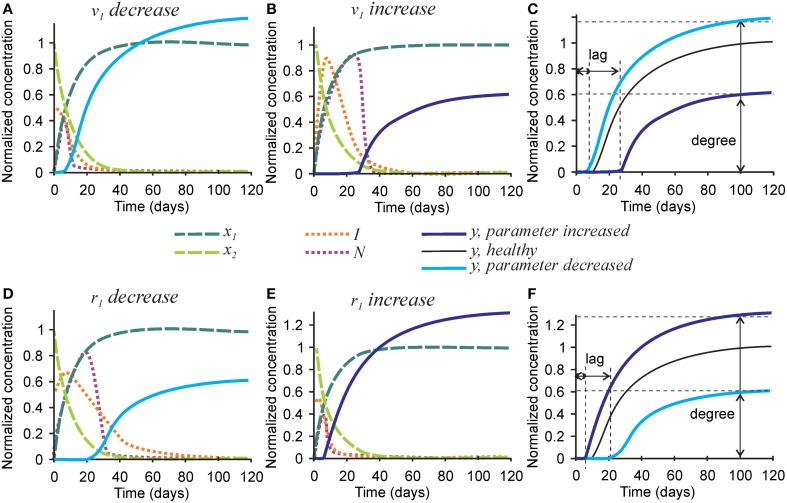
Figure 5.
The effect of parameters affecting inhibitor production and degradation on the mineralization outcome. (A–C) The effect of decreasing 10-fold (A) or increasing 10-fold (B) the rate of inhibitor production (v1). (C) Comparison of the mineralization lag time and degree in conditions affecting v1to healthy mineralization. (D–F) The effect of decreasing 3-fold (D) or increasing 3-fold (E) the rate of inhibitor degradation (r1). (F) Comparison of the mineralization lag and degree in conditions affecting r1 to healthy mineralization. The same color scheme is used as in Figure 2.

