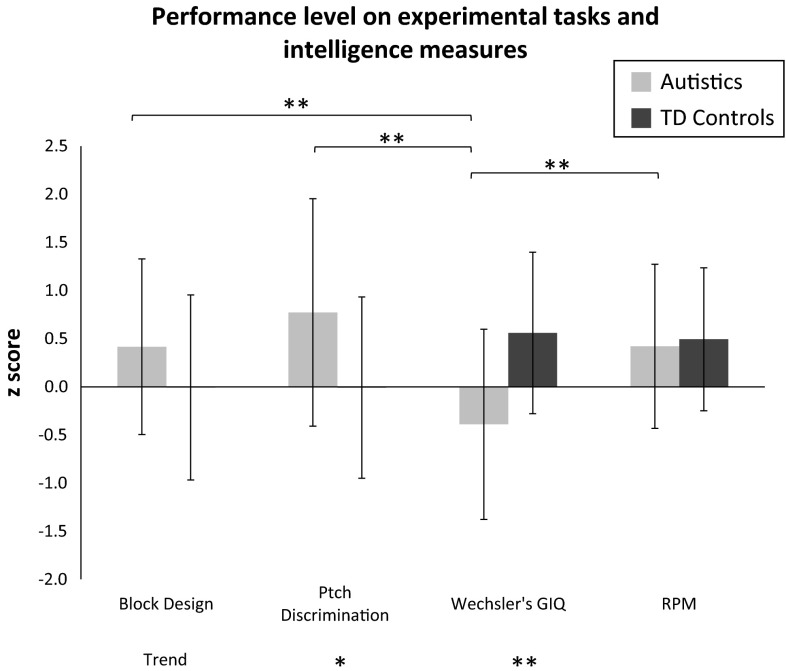
Fig. 3.
Performance level on experimental tasks (Block design, Pitch discrimination) and on intelligence measures (Wechsler’s Global IQ (GIQ), Raven Progressive Matrices (RPM)). Performance levels are shown in z score for autistics (light grey) and the typically developing (TD) controls (dark grey). The stars above the brackets, at the top of the graph, represent significance levels for differences in task performance separately for each group. The last line at the bottom of the graph indicates significance levels for between group differences in performance separately for each task and measure. ** p < 0.001; * p < 0.001

