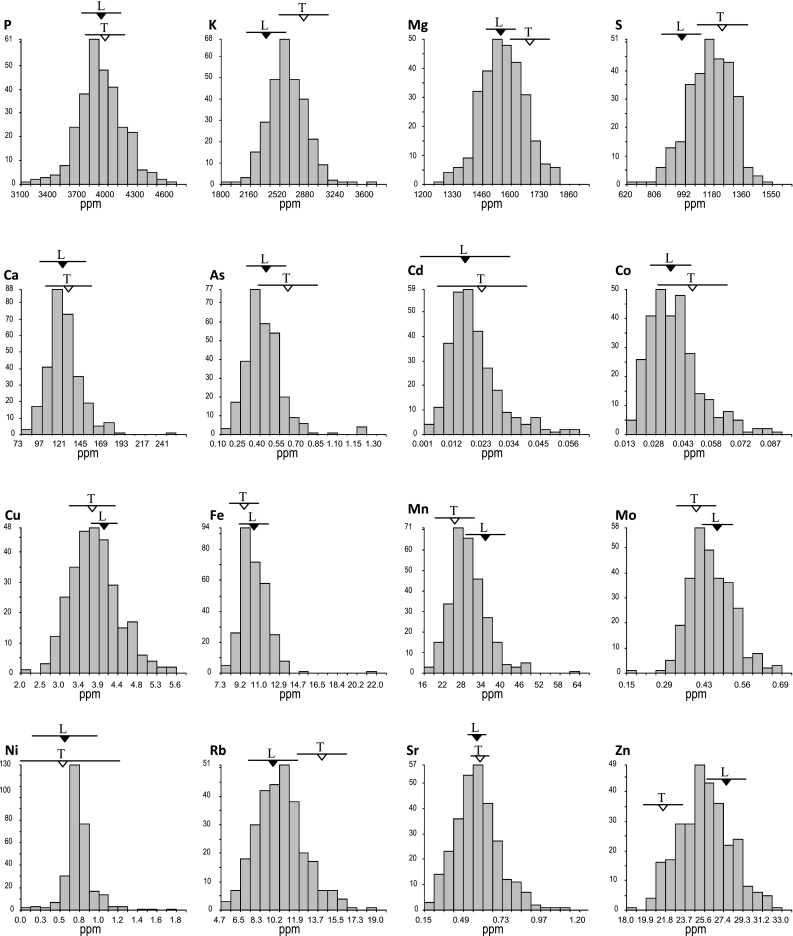
Fig. 1.

Histograms showing the range of the LS means observed among the population of 280 LT-RILs for the 16 elemental traits, all LT-RIL fields were flooded till all plots were mature and harvested. Elements are listed starting with the five macroelements (those reaching >100 ppm in rice grains), in order of their mean grain concentration, followed by the 11 remaining elements in alphabetical order. Also indicated are the LS Means (±1 standard deviation) of the multiple repeat check plots of the parental lines, Lemont and TeQing, grown in those same flooded fields
