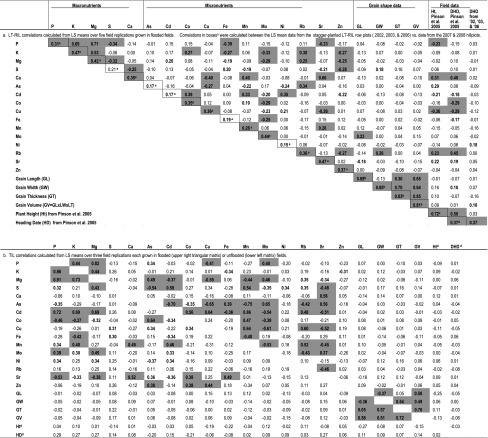
Table 1.
Correlations between traits in the LT-RIL and the TIL populations

Correlations between traits (grain element concentrations [ppm], grain shape, plant height, and days to heading) for the LT-RILs calculated from LS mean data across five field replications, all grown flooded. The averages of the pairwise correlations between the five LT-RIL years for each element are in the boxed cells. TIL data were analyzed separately for the flooded versus unflooded field conditions, and were grown only as hillplots in 2007 and 2008
Significance Levels: Bold text significant at the α = 0.05 level, Shading of cells indicates significance at the α = 0.01 level. Bonferoni adjustments were used to account for the multiple comparisons made
aAverages of the pairwise correlations between years reported in Supplementary Table 1
bThe between-year correlations for grain shape attributes were calculated from measurements made on 2002-harvested seed versus shape data from seed harvested in 2003
cCorrelations between the LT-RIL heading dates observed by Pinson et al. (2005) versus data presently collected from 2002, 2003, and 2006 stagger-planted plots
dTIL Height (Ht) and data on days to heading (DHD) data were from other field plots grown for other studies (Ht unpublished, DHD Pinson et al. 2012)
