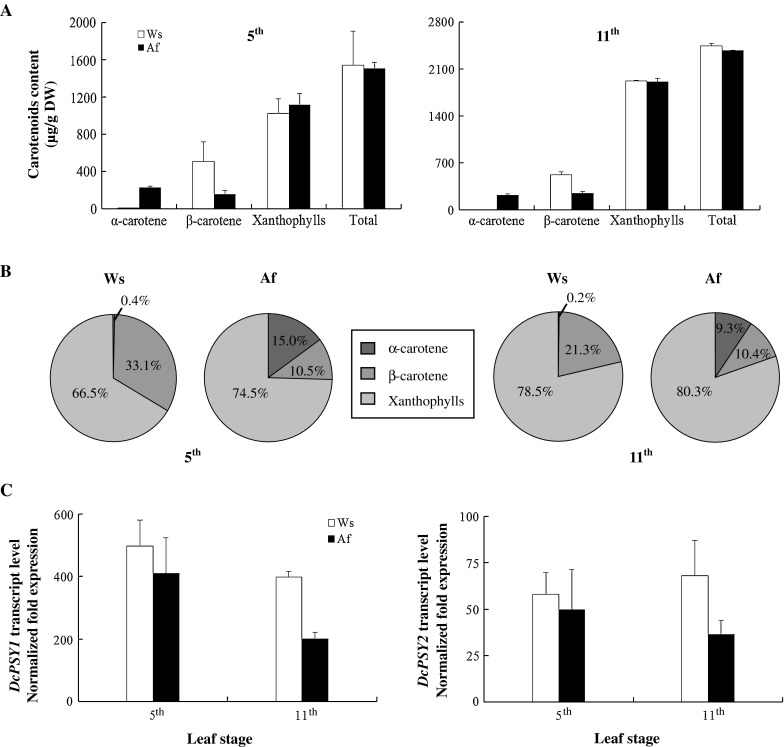
Fig. 4.

Relationship of carotenoid content and DcPSY gene expression in carrot leaves at the 5th and 11th leaf stages. a α- and β-Carotene, xanthophylls and total carotenoids were compared between the two stages. b Carotenoid composition patterns are shown for Ws and Af leaves. c Relative expression levels of DcPSY1 and DcPSY2 were compared between Ws and Af leaves. Expression levels are normalized against ubiquitin transcripts and compared with expression levels in Ws roots at the 4th leaf stage. Values are the means of three real-time qPCR replicates ±SD
