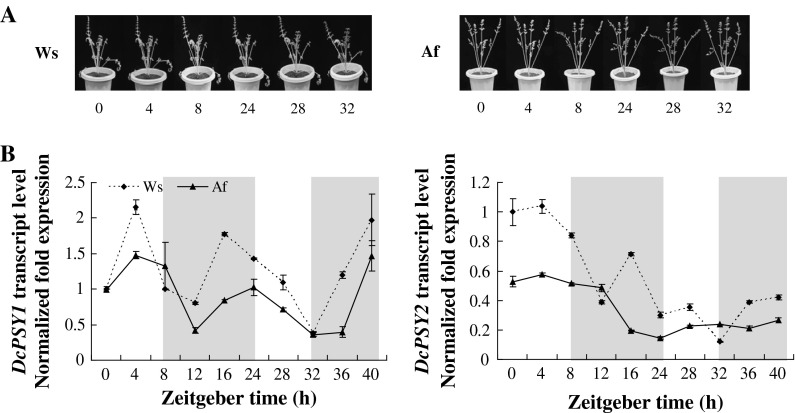
Fig. 5.
Relative expression levels of DcPSY1 and DcPSY2 during de-etiolation under sunlight. a Overview of leaf color changes under light treatment for 2 days. Af and Ws are shown on the left and right. Photographs were taken during the light treatment hours. b Relative expression levels of DcPSY1 and DcPSY2 under sunlight regulation. Plants were treated with 8-h natural sunlight treatment (from 0700 to 1500 hours), 16-h dark treatment (from 1500 to 0700 hours), followed by 8-h light treatment and 8-h dark treatment. Amplified products are normalized against ubiquitin and calibrated against Ws expression levels during the first 4 h of treatment. Values are mean ± SD from three biological replicates

