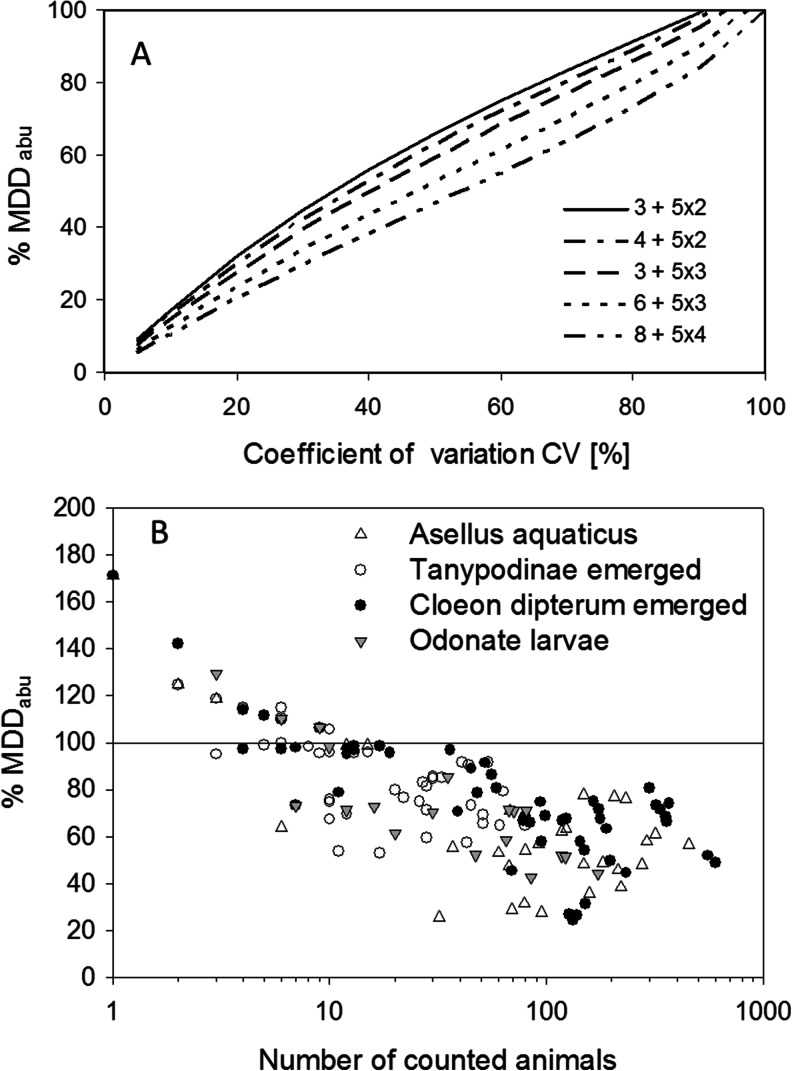
Fig. 1.
a Relationship between the coefficient of variation of a given endpoint and the MDDabu for log-transformed (ln(2x + 1)) abundance data as influenced by different numbers of replicates in both controls and treatments. Scenario—one-sided Williams’ test (p = 0.05), MDDabu shown for the fifth treatment level, mean abundance in control = 10. Explanation legend—3 + 5x2 = 3 control replicates and five treatment levels with two replicates. b Example of the relation between abundance (sum of individuals counted in four control ponds) and the MDDabu for four groups of macro-invertebrates in an outdoor mesocosm study (one-sided t test (p = 0.05)), transformed data (log factor a = 2); data based on four control ponds. Assumption—four controls and three treatment replicates with the same coefficient of variation

