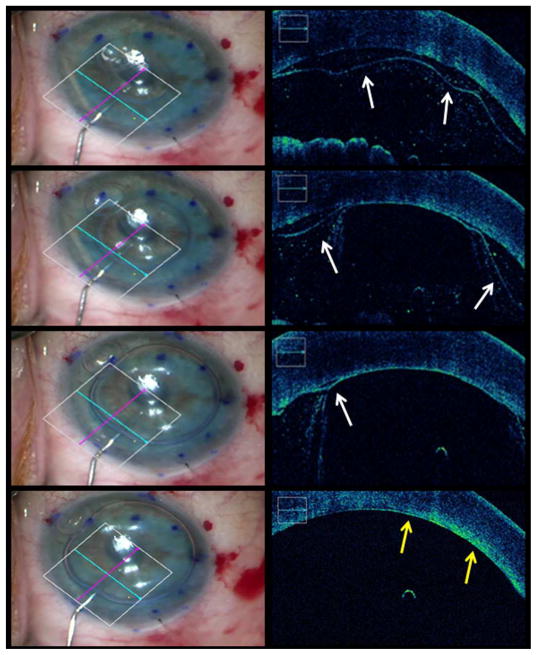
Figure 4. Intraoperative Optical Coherence Tomography Time-lapse Depictions of Graft Apposition Following Gas Infusion During Descemet Membrane Endothelial Keratoplasty.
From top to bottom the rows represent consecutive time-points. The left column shows en face views. In the right column, the accompanying intraoperative optical coherence tomography images from the en face views depict graft localization and the progression of graft apposition during gas infusion (white arrows indicate presence of interface fluid, yellow arrows indicate complete graft attachment to host tissue, see supplemental video 2).

