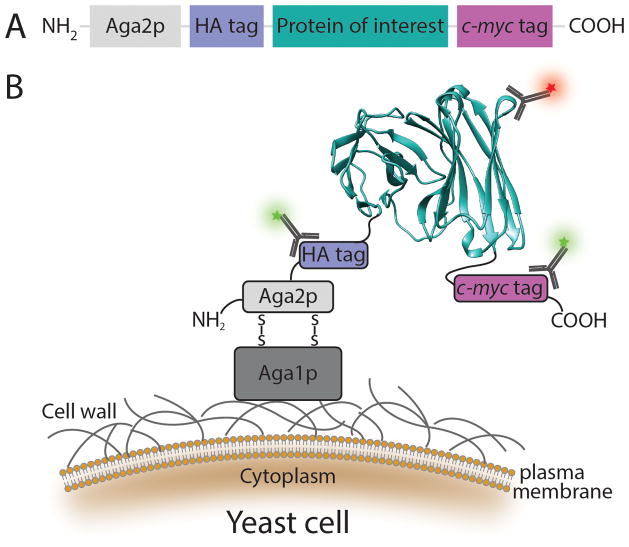
Figure 1.
Schematic representation of yeast surface display. (A) The protein of interest is flanked by two epitope tags: a 9-amino acid hemagglutinin antigen (HA) tag and a 10-amino acid c-myc tag, and is fused to the C-terminus of the a-agglutinin Aga2p subunit. (B) Protein display on the yeast cell surface. Following translation, the 69-amino acid Aga2p subunit associates with 725-amino acid a-agglutinin Aga1p subunit via two disulfide bonds. The fusion protein is subsequently secreted to the extracellular space where Aga1p is anchored to the cell wall via a β1,6-glucan covalent linkage. As a result, the protein of interest is displayed on the cell surface where it is accessible by soluble ligands. Functional display of the protein of interest (shown here as a scFv130 modified from PDB 1X9Q using the UCSF Chimera package131) can be detected by a fluorescently labeled antibody or ligand (red star) specific to the native fold. The epitope tags are used to normalize protein function to surface expression level through either labeled anti-HA or anti-c-myc antibodies (green stars). These features allow flow cytometric sorting of a heterogeneous mixture of yeast cells, each displaying up to 100,000 copies of a single protein variant, based on the biophysical and biochemical properties of the displayed proteins.

