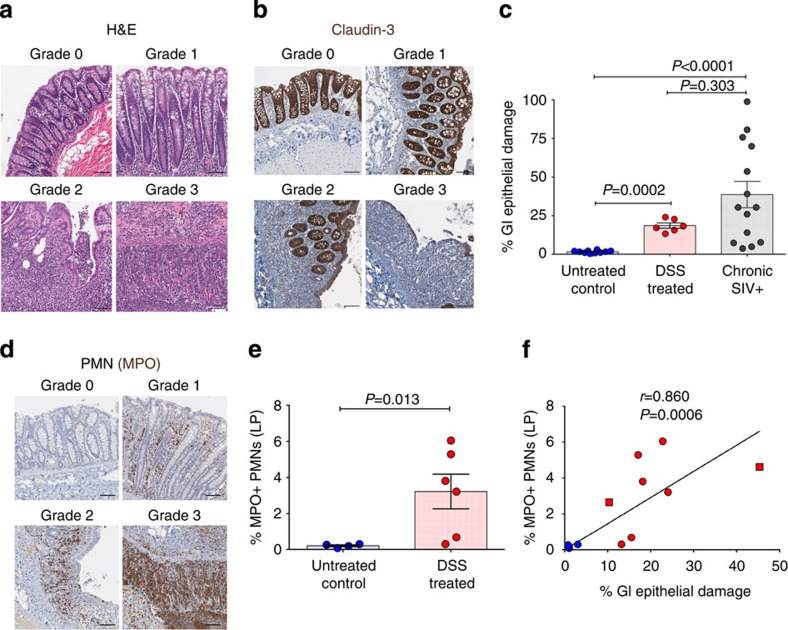
Figure 1. Extent and type of GI tract pathology induced by DSS treatment.
(a) Representative colon haematoxylin and eosin images showing normal grade 0 (untreated control RM) and grade 1–3 (DSS-treated RM) colitis. (b) Representative images of claudin-3-stained colon showing normal grade 0 (untreated control RM) and grade 1–3 (DSS-treated RM) lesions. Notice the strong claudin-3 expression in the colonic epithelium from grade 0 and grade 1, with reduced and absent claudin-3 expression in grade 2 and 3 lesions, respectively. (c) Quantification of the percentage of the colon linear length that is damaged (that is, claudin-3 negative). (d) Representative images of MPO-stained colon showing the lack of PMN infiltration in normal grade 0 (untreated control RM) colon and the increased PMN infiltrate in grade 1–3 (DSS-treated RM) lesions. (e) Quantification of the percent area of the colon (all segments) that is occupied by MPO+ PMNs. (f) Direct positive correlation between the extent of GI tract epithelial damage and the magnitude of PMN infiltration into the colon (all segments). Lines are based on linear regression and r and P values are based on Spearman rank correlation coefficient. P values are based on the Mann–Whitney test (c,e). Untreated control RMs (blue circles) n=4 (e,f) to 10 (c), acute DSS-treated RMs (red circles) n=6, chronic DSS-treated RMs (red squares) n=2, and chronic SIV+ RMs (grey circles) n=14. Bar graphs show group means ±s.e.m. with individual animal data points shown. Scale bars=100 μm.

