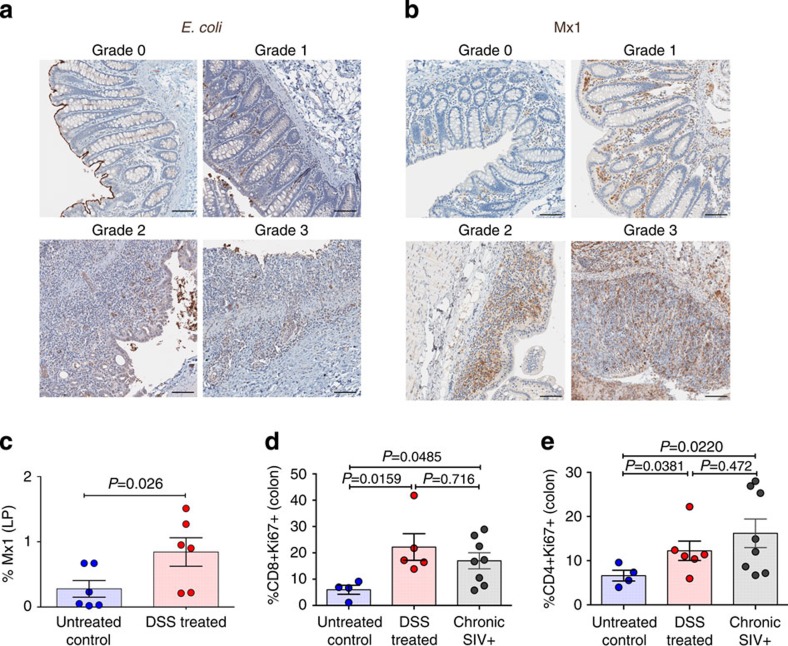
Figure 2. Effect of DSS-induced GI tract damage on local microbial translocation and resulting inflammation and immune activation.
(a) Representative images of E. coli-stained colon showing the lack of microbial translocation in normal grade 0 (untreated control RM) colon and increased presence of bacterial products in grade 1–3 (DSS-treated RM) lesions. (b) Representative images of Mx1-stained colon showing limited inflammation in normal grade 0 (untreated control RM) colon and increased inflammation in grade 1–3 (DSS-treated RM) lesions. (c) Quantification of the percent area of the colon lamina propria (LP) positive for Mx1. (d) The proportion of CD8+ T cells in the colon that express the activation/proliferation marker Ki67. (e) The proportion of CD4+ T cells in the colon that express the activation/proliferation marker Ki67. P values are based on the Mann–Whitney test (c–e). Untreated control RMs (blue circles) n=4 (d,e) to 6 (c), acute DSS-treated RMs (red circles) n=6, and chronic SIV+ RMs (grey circles) n=8. Bar graphs show group means ±s.e.m. with individual animal data points shown. Scale bars=100 μm.

