Fig. 5.

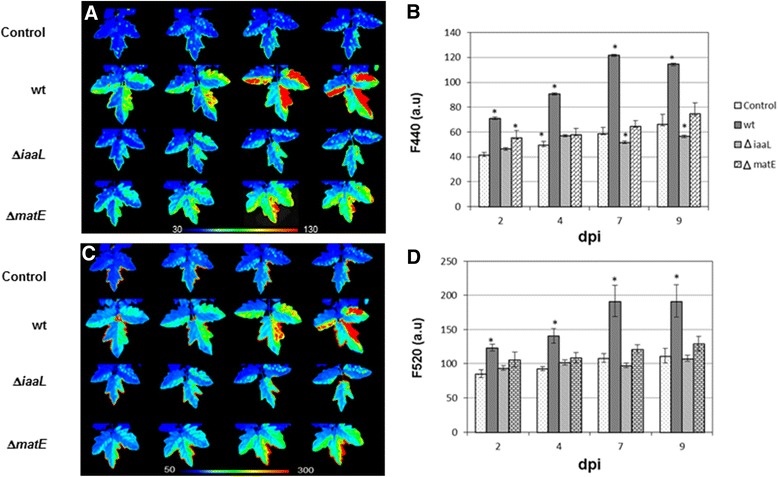
Host response to infection with P. syringae pv. tomato DC3000 and its ΔiaaL and ΔmatE mutant derivatives. a Images and b time course of blue fluorescence emission (F440) from tomato leaves infiltrated with either MgCl2 (control plants) or the indicated strains. c Images and d time course of green fluorescence emission (F520). Pictures show representative images of the fluorescence measurements carried out in control and bacteria-challenged tomato plants at 2, 4, 7 and 9 dpi. Three different experiments with four repetitions for every sample were performed. The color scale applied is shown for panels a and c. Averages for the whole inoculated area at each dpi assayed are displayed; error bars indicate standard error and significant differences are marked (*)
