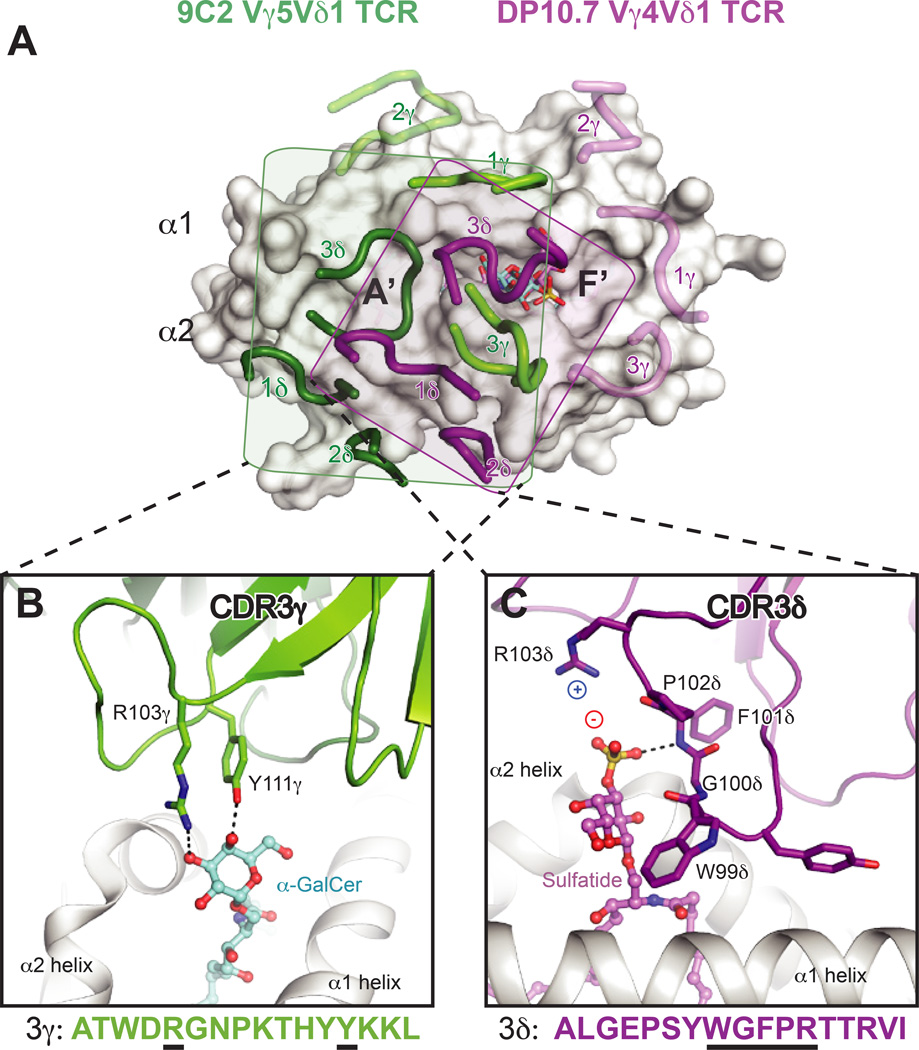
Fig. 5. Differential interaction modes of human γδ TCRs with CD1d–lipid complexes.
(A) Footprints of the DP10.7 (PDB ID: 4mng) and 9C2 TCRs (PDB: 4lhu) upon CD1d–lipid complexes. The two complex structures were aligned via CD1d to show the different orientation of the CDR loops upon the CD1d surface. CD1d is shown as a white surface. The 9C2 TCR CDR loops are shown in light green (γ) or dark green (δ), and the corresponding lipid recognized by this TCR, αGalCer, is shown in aquamarine sticks. The DP10.7 TCR CDR loops are shown in pink (γ) and purple (δ), and the corresponding lipid contacted, sulfatide, is shown in pink. The rough borders of each of the TCR footprints in depicted by a shaded box for the 9C2 (box in green) and DP10.7 TCR (purple). For both TCRs, loops that do not contact CD1d–lipid are shown as transparent. (B) Detail of the 9C2 TCR-αGalCer interface. The CDR3γ loop is shown in green, and residues that contact αGalCer are labeled and shown as sticks. Below, the CDR3γ amino acid sequence is depicted, with residues that contact αGalCer underlined in black. (C) Detail of the DP10.7 TCR sulfatide interface. The CDR3δ loop is shown in purple, and residues that contact αGalCer are labeled and shown as sticks. Below, the CDR3δ amino acid sequence is depicted, with residues that contact αGalCer underlined in black. For (B) and (C), hydrogen bonds are shown as dash lined, and salt-bridge interactions are highlighted by showing the charge of the involved residues/moieties.

