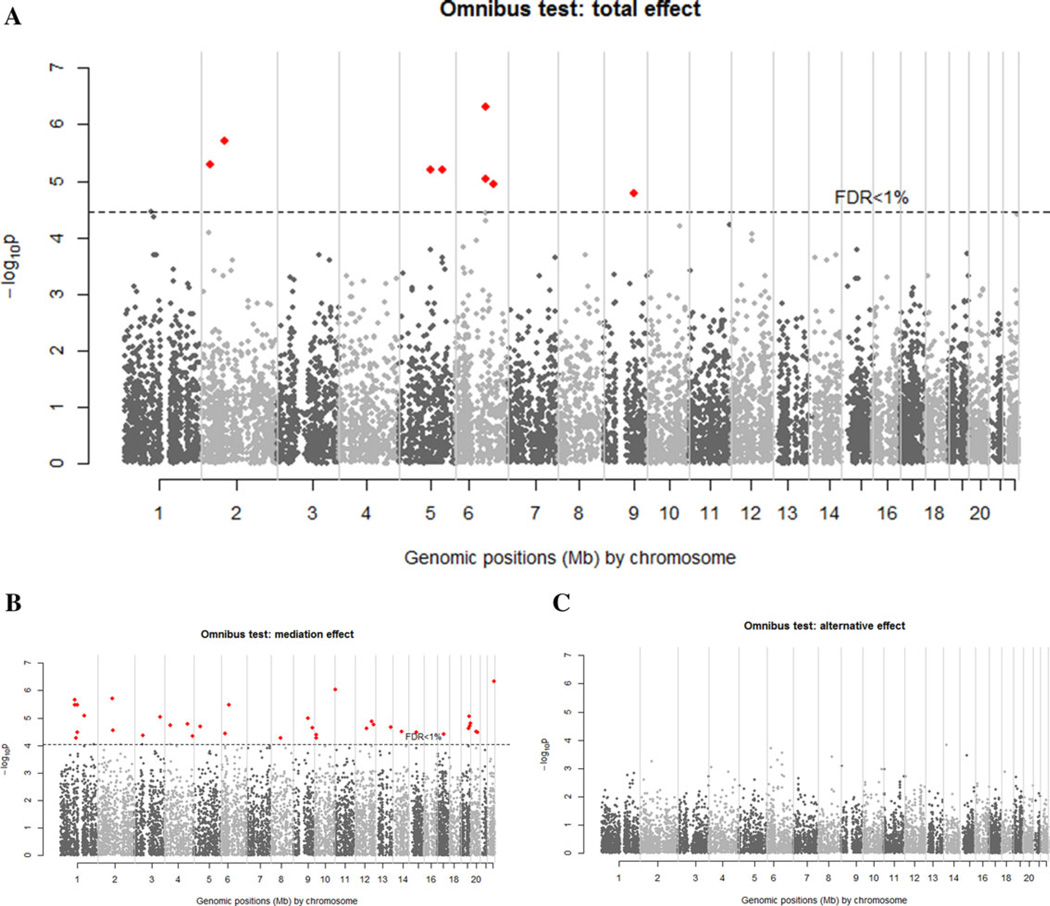
Figure 2.
Manhattan plots of genome-wide scan of the asthma data using SNPs and gene expression data with the gene-centric iGWAS approach. Analysis is restricted to eQTLs. (A) Omnibus P-values for total effects; (B) omnibus P-values for mediation effects; (C) omnibus P-value for alternative effects. Red dots indicate the transcripts found from the omnibus test with FDR < 1%.

