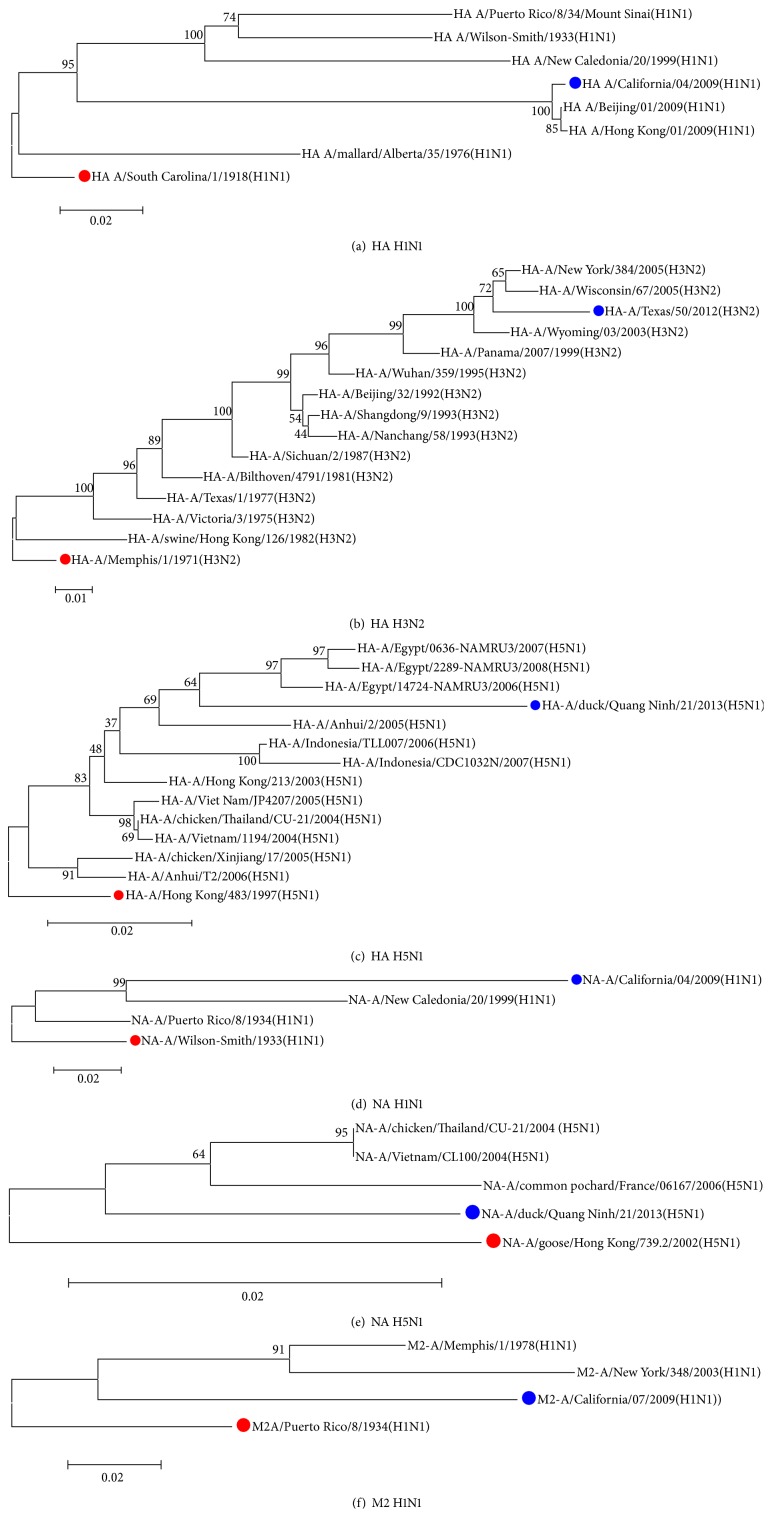
Figure 5.
The red circle indicates the sequence in which the epitope was first identified. The blue circle shows the 2013-2014 season vaccine strain, in the case of H1N1 and H3N2, and the current strain, in the case of H5N1. The evolutionary history was inferred using the Neighbor-Joining method. The following branch shows the replication percentages with which the taxa associated in the bootstrap test. The trees are drawn to scale, with the longest of the branches in the same units of evolutionary distance used to infer the phylogenetic tree. The evolutionary distance was calculated using the Poisson method and is presented in substitution site units. The analysis was completed using the MEGA 6 program. Shown are (a) the optimum tree with a sum of branches of 0.43300672; (b) the optimum tree with a sum of branches of 0.30107033; (c) the optimum tree with a sum of branches of 0.20974655; (d) the optimum tree with a sum of branches of 0.29223355; (e) the optimum tree with a sum of branches of 0.07724998; (f) the optimum tree with a sum of branches of 0.28312403.

