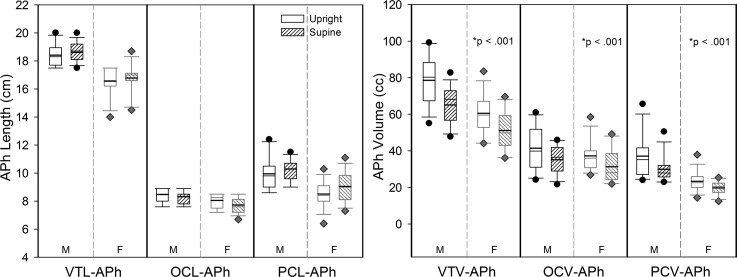
FIG. 3.
Box plots of APh data for length (left figure) and volume (right figure) for the VT, OC, and PC in males (M) and females (F) in the upright (no fill) and supine (hashed) body positions. The upper and lower bounds of the box are the 75th and 25th percentiles, respectively. The solid black line represents the mean, and the solid gray line represents the median. The upper and lower whiskers represent the 90th and 10th percentiles, respectively, with the black dots and gray diamonds representing outlying data for males and females, respectively. Asterisk denotes significance for body position.

