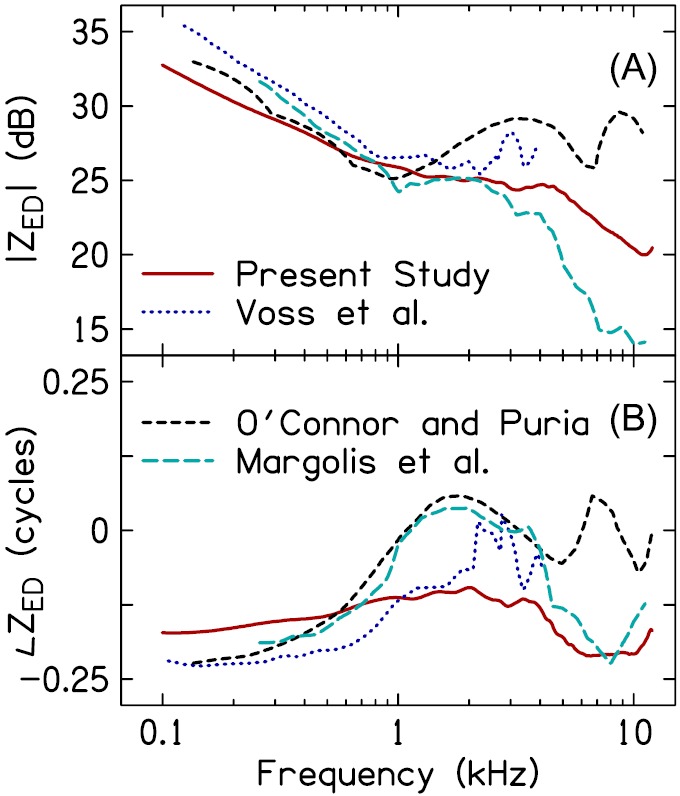
FIG. 10.

(Color online) Comparison of ZED across studies. (A) plots the magnitude of ZED and (B) plots the phase of ZED. Data for the comparison studies were taken from Voss et al. (2001b), O'Connor and Puria (2008), and Margolis et al. (1999). ZED from Voss et al. (2001b) and O'Connor and Puria (2008) was based on measures in cadaver ears whereas ZED from Margolis et al. (1999) was from living ears. The present study's estimate represents the average across subjects and probe-insertion depths.
