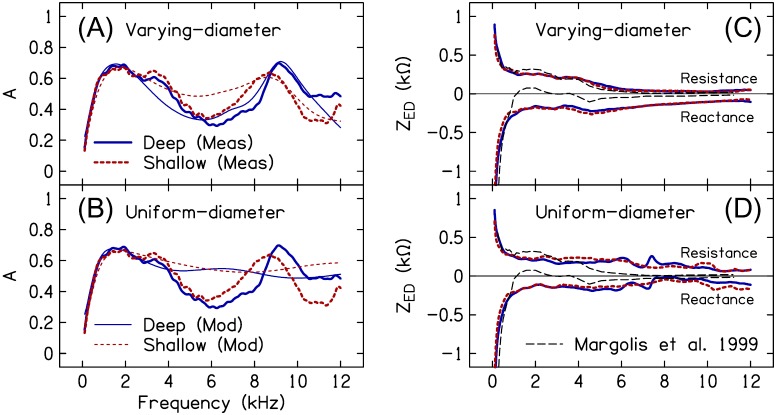
FIG. 11.
(Color online) Modeled and measured A and estimated ZED resistance and reactance in a varying-diameter canal model compared to a uniform-diameter canal model. Mean modeled (thin lines) and measured (thick lines) A for the deep (solid lines) and shallow (dashed lines) probe placements are shown in (A) for the varying-diameter canal model and in (B) for the uniform-diameter canal model. Mean estimated ZED resistance and reactance for the two probe placements are shown in (C) for the varying-diameter canal model and in (D) for the uniform-diameter canal model. The thin dashed black lines in (C) and (D) are data from Margolis et al. (1999). Note that the frequency axis is linear to emphasize the high-frequency portion of the data.

