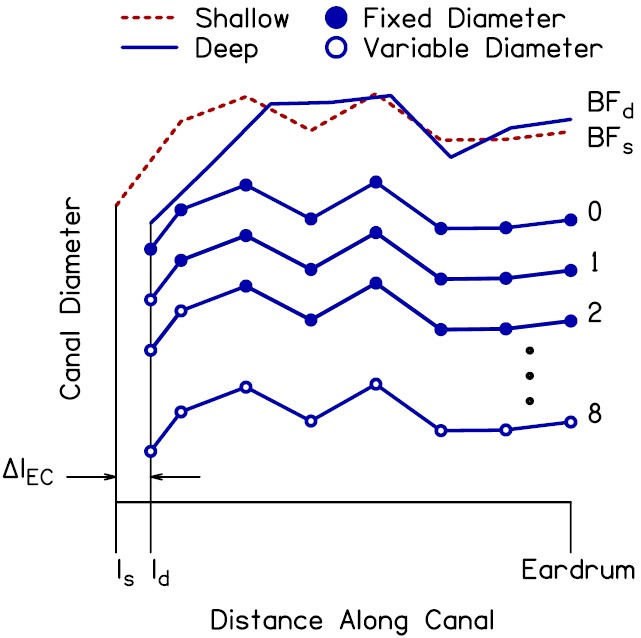
FIG. 12.

(Color online) Illustration of the method used to create variations of the shallow ear-canal diameter profile, from which Adeep was calculated. The best-fit diameter profiles determined from step 2 of the optimization procedure for the shallow and deep probe placements (BFs and BFd) are shown by the dashed and solid lines, respectively, at the top of the panel. The shallow profile was shortened by a length ΔlEC to create the deep diameter profile 0. The filled symbols identify the resulting entrance and exit diameters of the seven conical segments of the canal model. Diameter profile 1 had the same diameters as profile 0 (indicated by the filled markers) with the exception of the diameter at the plane of the probe (ld). Optimization was used to determine the value of this diameter that best fit the measured Adeep (the open marker indicates that the final value of this diameter was determined using optimization–note that the final value is not shown in the figure). Similarly, diameter profile 2 had the same diameters as profile 0 with the exception of both the diameter at the plane of the probe and the adjacent diameter. Optimization was used to determine the final values of these diameters that best fit the measured Adeep. This pattern continued until optimization was used to determine the final values of all eight diameters, i.e., profile 8, to better fit the measured Adeep.
