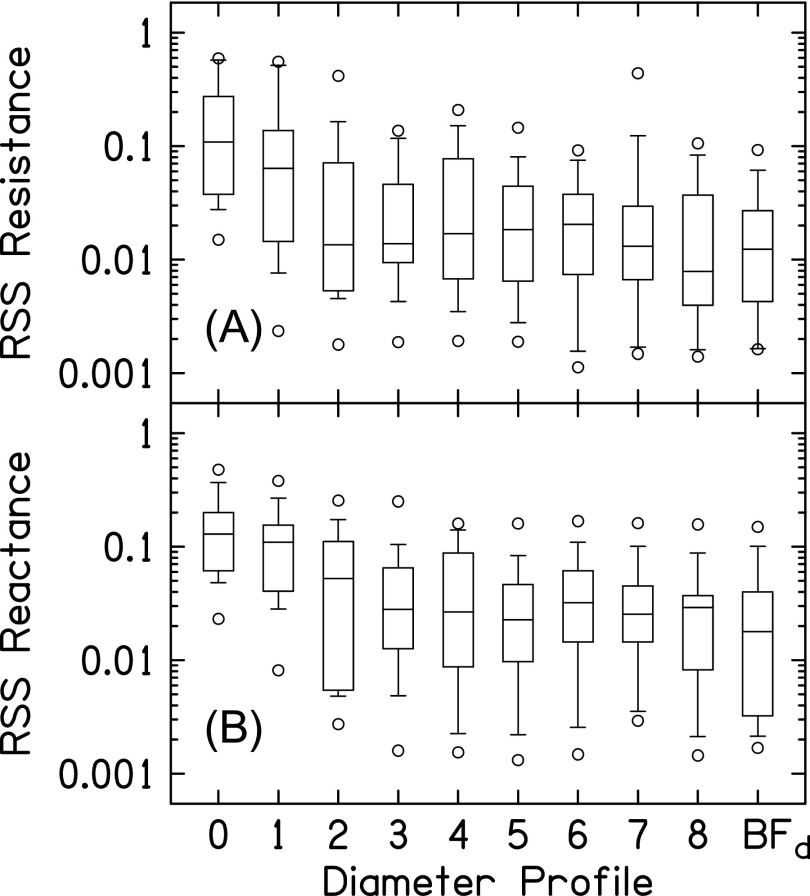
FIG. 14.
Differences between resistive and reactive components of ZED_shallow and ZED_deep for the deep diameter profiles. (A) plots the distributions (across subjects) of the RSS between the resistive component of ZED_shallow and ZED_deep. (B) plots the distributions of the RSS between the reactive component of ZED_shallow and ZED_deep. The key to the box-and-whisker plot is shown in Fig. 13.

