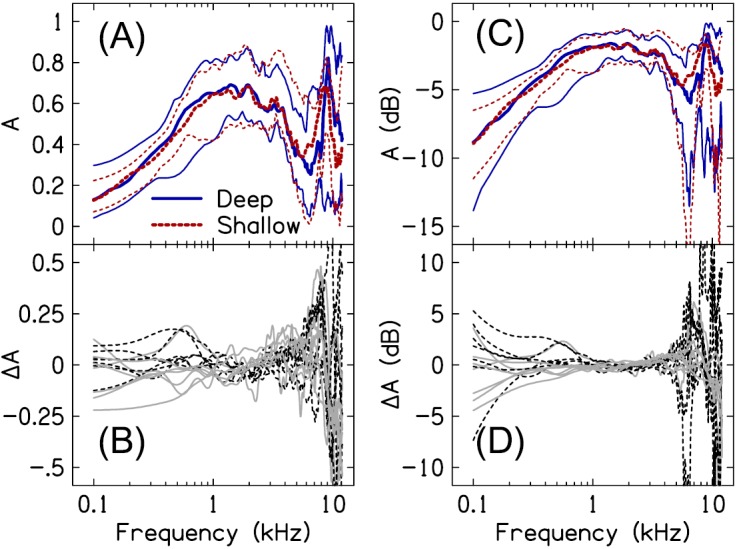
FIG. 3.

(Color online) Effect of probe-insertion depth on absorbance. (A) and (C) plot the absorbance in linear and dB units, respectively, for deep (solid lines) and shallow (dashed lines) insertion depths. The thick lines correspond to the 50th-percentile of the data; the thin lines above and below the 50th-percentile represent the 90th- and 10th-percentiles of the data, respectively. (B) and (D) plot the difference in A between probe placements in linear and dB units, respectively. Data from subjects with an air leak effective diameter ≤0.5 mm are shown by the solid gray lines; data from subjects with no air leak are shown by the dashed black lines.
