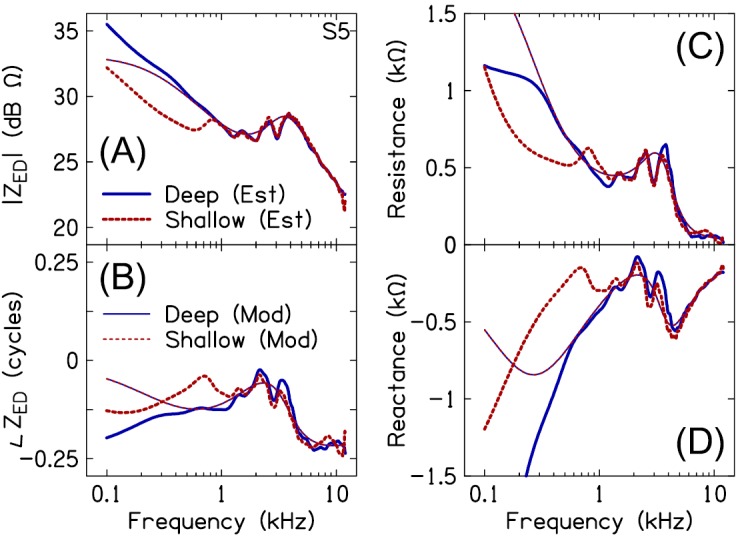
FIG. 6.

(Color online) Measured versus modeled eardrum impedance (ZED) magnitude (A), phase (B), resistance (C), and reactance (D) for deep (solid lines) and shallow (dashed lines) insertion depths, in a single subject (S5). Note that the model fits for the deep and shallow probe placements are identical.
