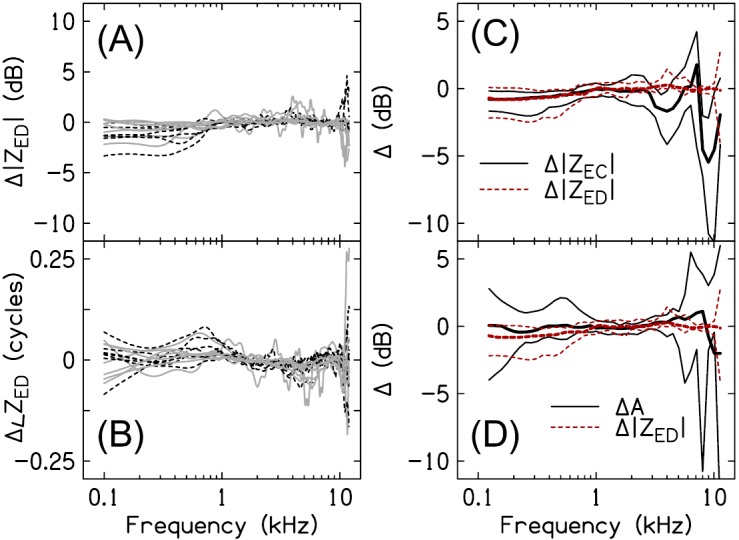
FIG. 8.

(Color online) Probe insertion-depth sensitivity of ZED. (A) and (B) plot magnitude and phase differences, respectively, between ZED estimated from the shallow and deep insertion depths. Data from subjects with an air leak of ≤0.5 mm are shown by the solid gray lines; data from subjects with no air leak are shown by the dashed black lines. (C) and (D) compare the insertion-depth sensitivity (10th-, 50th-, and 90th-percentiles) of ZED to that of ZEC and A, respectively.
