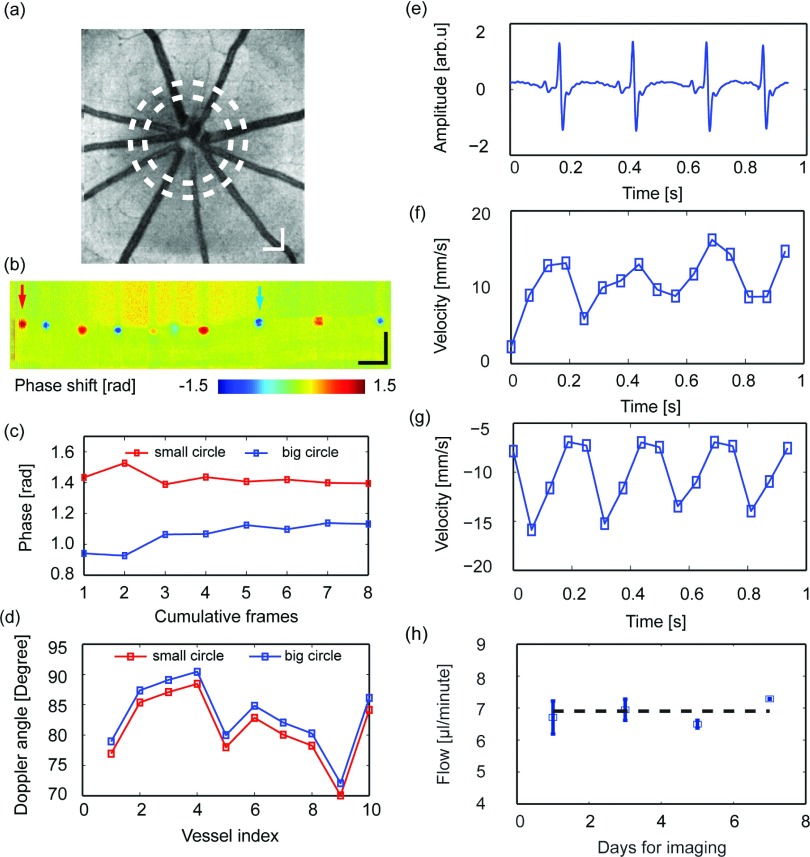
FIG. 3.
In vivo imaging of retinal blood flow in rodents. (a) Fundus imaging of a rat eye; the two dashed circles indicate where the dual-ring scans were performed. (b) The phase image from the inner-circle scan. (c) Phase stability across a different number of cumulative frames for a sample vessel, indicated by the left arrow in panel (b). (d) Estimated Doppler angles for all the vessels from both small and large scanning locations. (e) Recorded rat electrocardiogram during imaging. (f) Measured pulsatile flow from one retinal artery, highlighted by the left arrow in panel (b). (g) Measured pulsatile flow from one retinal vein, highlighted by the right arrow in panel (b). (h) Consistency in flow imaging of the same rodent subject over seven days. Bar: 200 μm.

