
FIG. 12.
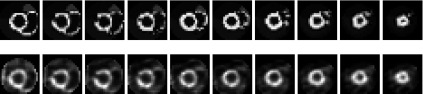
Top: activity distribution in the NCAT phantom with a lateral defect. Bottom: short-axis slices reconstructed from segmented slant-hole projection data show the location of the defect. Images were reconstructed by the tailored ML-EM algorithm with 35 iterations. The nonuniformity is due to the rotation transformation.