Abstract
Animal models that mimic human cardiac disorders have been created to test potential therapeutic strategies. A key component to evaluating these strategies is to examine their effects on heart function. There are several techniques to measure in vivo cardiac mechanics (e.g., echocardiography, pressure/volume relations, etc.). Compared to echocardiography, real-time left ventricular (LV) pressure/volume analysis via catheterization is more precise and insightful in assessing LV function. Additionally, LV pressure/volume analysis provides the ability to instantaneously record changes during manipulations of contractility (e.g., β-adrenergic stimulation) and pathological insults (e.g., ischemia/reperfusion injury). In addition to the maximum (+dP/dt) and minimum (-dP/dt) rate of pressure change in the LV, an accurate assessment of LV function via several load-independent indexes (e.g., end systolic pressure volume relationship and preload recruitable stroke work) can be attained. Heart rate has a significant effect on LV contractility such that an increase in the heart rate is the primary mechanism to increase cardiac output (i.e., Bowditch effect). Thus, when comparing hemodynamics between experimental groups, it is necessary to have similar heart rates. Furthermore, a hallmark of many cardiomyopathy models is a decrease in contractile reserve (i.e., decreased Bowditch effect). Consequently, vital information can be obtained by determining the effects of increasing heart rate on contractility. Our and others data has demonstrated that the neuronal nitric oxide synthase (NOS1) knockout mouse has decreased contractility. Here we describe the procedure of measuring LV pressure/volume with increasing heart rates using the NOS1 knockout mouse model.
Keywords: Medicine, Issue 100, murine, catheterization, contractility, PV loops, end-systolic pressure volume relationship, preload recruitable stroke work, NOS1
Introduction
The purpose of the heart is to pump blood throughout the body to meet the metabolic demands of the organism. Since these demands are constantly fluctuating (e.g., during exercise), the heart must adapt (i.e., increase cardiac output). The heart has devised numerous pathways to accomplish this feat. The prime manner the heart achieves this is via an increase in heart rate (i.e., Bowditch effect)1. That is, as one’s heart rate increases, this results in an increase in contractility and an increase in cardiac output. Thus, heart function is exceedingly dependent upon heart rate. Unfortunately, heart disease (e.g., myocardial infarction, hypertrophy, etc.) results in poor heart function in which the heart consequently will not be able to meet the metabolic demands of the body. Heart disease is the main cause of morbidity and mortality in Western society. Animal models that recapitulate many human cardiomyopathies are used to investigate molecular mechanisms and to test potential therapies. To discern these mechanisms and determine if a therapy may be viable, investigators must assess heart function in vivo.
There are several ways to assess heart function in vivo (e.g., echocardiography, MRI, etc.), which routinely measure ejection fraction, fractional shortening, cardiac output, etc. However, these parameters are highly dependent upon afterload, preload, and heart rate in addition to contractility2. Measuring contractility is indispensable to comprehend the intrinsic properties of the heart in its native environment. The maximum (dP/dtmax) rate of pressure development brings us a step closer to understanding contractility. Unfortunately, dP/dt is also dependent upon heart rate and loading conditions3. Therefore techniques have been developed to measure load (and heart rate, see below) independent indices of myocardial contractility (i.e., end systolic pressure volume relationship (ESPVR) and preload recruitable stroke work (PRSW))4-6. ESPVR describes the maximal pressure that can be developed by the ventricle at any given LV volume. The slope of ESPVR represents the end-systolic elastance (Ees). PRSW is the linear regression of stroke work (area enclosed by the PV loop) with the end-diastolic volume. These procedures are a more accurate and precise measurement of contractility compared to hemodynamic parameters such as ejection fraction, cardiac output, and stroke volume. ESPVR and PRSW can be obtained via the temporary blocking of the inferior vena cava (IVC). Blocking the IVC can be performed with a closed chest to avoid the effect of changing intrapleural pressure on heart function.
Increasing heart rate also enhances contraction and relaxation1. Thus, when comparing heart function between experimental groups (e.g., ± dP/dt), heart rates need to be similar. However, similar heart rates usually do not occur in each animal due to various conditions (disease, research intervention, etc.). It should be noted that anesthesia (injectable and inhaled) lowers heart rate. As heart rate is a major determinant of contractility, anesthesia will considerably affect contractility. For this reason, we are describing our procedure. Additionally, a hallmark of many cardiomyopathies is a decreased contractile reserve (i.e., a decreased Bowditch effect). Therefore, heart function should be measured over a range of heart rates. Here we describe how to use a stimulator (with a closed chest) to achieve these effects.
In addition to heart rate, nitric oxide (NO) is also an important modulator of contractility7. NO is produced via enzymes termed NO synthase (NOS). We and others have shown that mice with knockout of neuronal NOS (NOS1-/-) have blunted myocyte contraction and in vivo cardiac hemodynamics8,9. This mouse will be used to demonstrate the measurement of left ventricular contractility via the LV pressure/volume analysis procedure performed at various heart rates.
Protocol
NOTE: This animal protocol was approved by the Institutional Animal Care and Use Committee (IACUC) at The Ohio State University. This procedure can be used on any mouse in which the inner diameter of the carotid artery is large enough to insert the catheter. Use mice that are above 16 g (older than ~2 months).
1. Preparing Mouse for Catheterization
Seal all surgical instruments and supplies in a sterilization pouch. Sterilize the pouch in an autoclave machine. Maintain a sterile field throughout the procedure and wear sterile gloves.
Anesthetize mice with ketamine (55 mg/kg) plus xylazine (15 mg/kg) by intraperitoneal injection. NOTE: The whole procedure measuring both pressure/volume at various heart rates and ESPRV takes less than 20 min. If additional time is required (i.e., more than 30 min), give an additional ¼ dose of anesthesia every 30 min.
Remove the hair in the anterior region of neck and chest area using hair removing lotion (e.g., Nair) and tape the limbs of the mouse onto the foam platform. Confirm a state of deep anesthesia by a toe pinch.
Insert a rectal probe to monitor the body temperature (37 ± 1 °C), and maintain using a thermo-regulated heating pad (located between the surgical drape and platform).
Prepare a length of 4-0 suture (~10 cm). Loop suture around the upper incisors and tape to platform. This will keep the neck straight.
Sterilize the surgical area by swabbing the area with Betadine and 75% alcohol three times.
2. Catheterization
Prepare the catheter by presoaking the tip in saline or distilled water (37 °C) for at least 30 min prior to use (according to manufacturer’s instructions) to acclimate the pressure sensor diaphragm for the wet biological environment and to prevent pressure signal drift and negative pressure recordings.
Make a longitudinal 0.8 cm incision between the lower jaw and sternum in the anterior region of the neck. With the fine scissors, separate the skin-muscular connective tissue to expose the trachea located under the stemohyoideus muscle.
Separate the fat and muscular tissue at the right side of the trachea with curved forceps to expose the right carotid artery. NOTE: The carotid artery is the biggest artery in the anterior region of the neck, contains bright red blood, and is pulsatile. Do not confuse with the jugular vein that runs parallel to the carotid artery. The jugular vein is dark red and non-pulsatile. In addition, during the isolation of the carotid artery, the user should be aware of not damaging the pneumogastric nerve.
Remove the fat from the right carotid artery with the curved forceps. If there exists branching of the vessel which will impede this operational technique, cut them with a Bovie cautery to dissociate the carotid artery. Separate as much of the tissue as possible under the carotid artery using curved forceps.
Cut two 5 cm 6-0 silk threads. Pass each silk thread under the right carotid artery.
Position one thread near the proximal part and the other near the distal part of the artery. Make a tight knot on the thread at the distal part, and make a loose knot on the thread at the proximal part.
Block blood flow by clamping the proximal part of the artery using a small hemostat vascular clamp (place the clamp below the proximal thread). The sealed region of the artery will be filled with blood making it easy to perform step 2.8.
Puncture a small hole in the right carotid artery between the two threads (but closer to the distal thread) with a 26 G needle. Insert the catheter into the carotid artery. Slightly tighten the loose knot at the proximal part of the carotid artery onto the catheter to keep in place. NOTE: Using the needle puncture is preferred compared to scissors incision. By making a tight knot in the distal part of the artery first, and then clamping the proximal part, the artery will be fully filled with blood. This makes it very easy to poke through the blood vessel. Furthermore, the size of the needle (26 G) punctures the artery with a hole that nicely fits the size of the catheter. When using the scissors incision method, it was more difficult to control the size of the incision. However, the method chosen should be dependent upon on which one the surgeon feels more comfortable with.
Start recording pressure signals as in step 3.
Loosen the hemostat clamp and continue inserting the catheter forward into the left ventricle. If some resistance is experienced when advancing the catheter, gently pull it back and try advancing again. For a mouse weighing ~18-25 g, the estimated length of the catheter that is inserted is 18 mm. NOTE: The arterial pressure signal will fluctuate from 70 to 120 mm Hg. Once the catheter is in the left ventricle the shape of the pressure signal changes and the pressure will fluctuate from 0 to 120 mm Hg (shown in Figure 1). Heart function will stabilize within 2-3 min after insertion of the catheter.
Continuously monitor body temperature, anesthesia level, and breathing rate.
3. Data Acquisition
Use LabChartPro 7 software (or similar software). Use the WorkFlow option of the PV Loop LabChart Module. Using this module, select the Pressure and Volume Loops default setting.
Set-up three channels: one channel for pressure, one channel for volume, and one channel for heart rate. Set scale ranges of above parameters as 0-150 mm Hg, 0-100 µl and 0-800 beat/min, respectively.
Press start key to record.
4. Bowditch Effect
Make a 1 cm incision in the precordium area parallel to the manubrium. Cut the layer of muscle and expose the intercostal space using scissors.
Using a square pulse stimulator, set the following parameters: Voltage of 2 V, duration of 2 msec, and enable repeat mode.
Hold the negative electrode with forceps and insert it through the fourth intercostal space to the apical region of the heart. Hold the positive electrode with forceps and insert it through the second intercostal space to the right atrium region of the heart.
Turn on the stimulator and change the frequency to pace the heart from 4 Hz (240 beats/min) up to 10 Hz (600 beats/min). At each new heart rate, stimulate the heart for 1 min before data collection.
5. Generating the ESPVR and PRSW
Cut the skin and muscle tissue perpendicular to the manubrium in the abdominal area with scissors. Open the enterocoelia and expose the liver.
Drag the arcus costarum towards the head using metallic traction.
Gently push the liver downwards with a cotton swab. Be careful not to push too much to affect the chest cavity. This will change heart function.
Cut the falciform ligament of the liver with scissors to expose the suprahepatic inferior vena cava (IVC).
Use curved forceps to rapidly squeeze the IVC for 5 sec to block the return of blood to the right atrium. The left ventricular pressure and volume will fall due to the reduced inflow to the heart. In generating these values, do not use loops below 60 mm Hg. The 60 mm Hg is in reference to systolic pressure. NOTE: This value is set at 60 mm Hg because this will cause a significant drop in perfusion pressure to considerably decrease coronary perfusion and affect contractility.
6. Volume Calibration
Heparinize the mouse with 0.1 ml of 1:5,000 heparin solution (diluted with normal saline) by intraperitoneal injection.
Remove the catheter from the carotid artery. When the catheter is pulled out from the carotid artery, heparinized blood will seep from the hole where the catheter was inserted.
Collect this blood for volume calibration using a 1 ml syringe. Fill each well in calibration cuvette.
Remove heart to euthanize the mouse via exsanguination.
Position the catheter in each well and get a steady relative volume unit (RVU) value. Generate a standard curve using the various standard volumes and RVU values from each well.
Convert the recorded RVU to µl.
7. Data Processing
To examine the Bowditch effect, select steady-state pressure/volume traces from each heart rate. Click the baseline analysis to obtain data.
For ESPVR and PRSW data, select the first ~15 pressure/volume traces, click occlusion analysis in the software to generate the ESPVR (slope of the pressure developed by the LV at end-diastolic volume) and PRSW (the linear regression of stroke work with the end-diastolic volume ) slopes.
Give attention to the shape of the loops. Make sure the loop is closed with no angular points or twists. This is a sign of improper catheter placement or excess noise. Periodically check loops during the experiment to ensure proper pressure and volume data are being generated.
Representative Results
The proper insertion of the catheter into the left ventricle is an important step to attain appropriate pressure and volume values. Shown in Figure 1, using LabChart Pro 7, is the changing of the pressure waveform (shape and values) as the catheter goes from the artery into the ventricle.
After proper insertion of the catheter into the left ventricle, the pressure (P) and volume (V) values obtained will then be used to generate the PV loops (shown in Figure 2).
Using these pressure values, mechanisms that alter contractility can be investigated. Shown in Figure 3 is an example of how pressure and volume changes as heart rate increases. In this example, increasing the heart rate from 300 to 600 beats/min, the LV pressure increased from 80 to 100 mm Hg, while the diastolic and systolic LV volumes decreased. Shown in Figure 4 is the heart rate dependence of the maximum and minimum rates of pressure development (dP/dt). As heart rate increases, so does the maximum and minimum rates of pressure development. This type of data analysis can also be used to investigate regulators of contractility. Our data demonstrates that NOS1-/- mice have decreased maximum and minimum rates of pressure development compared to wildtype (WT) mice (Figure 4). Hence, knockout of NOS1 results in a decreased Bowditch effect.
Using the pressure and volume values obtained during IVC occlusion, we can also obtain a measure of load-independent contractility. Shown in Figure 5, are calculated Ees and PRSW values (measured at 420 beats/min) for WT and NOS1-/- mice. These data suggest that NOS1-/- mice have decreased contractility compared to WT mice.
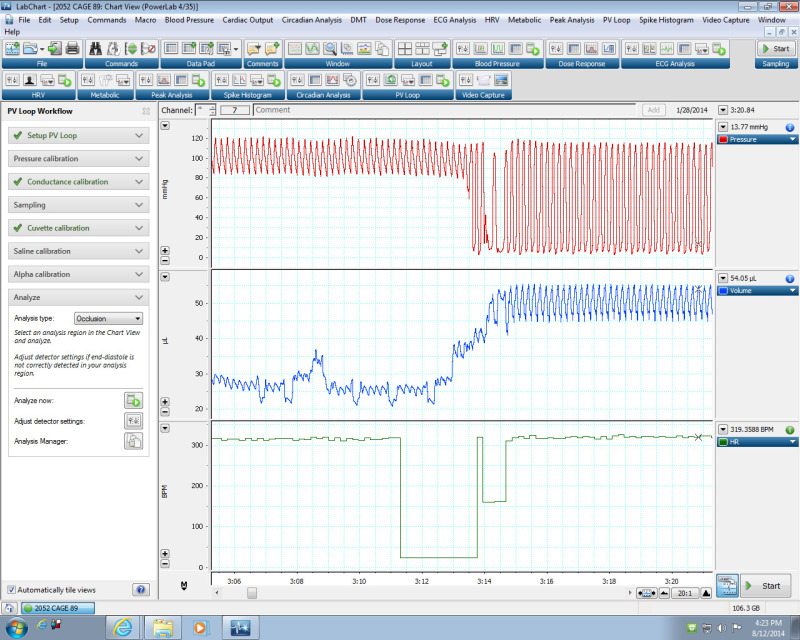 Figure 1:The pressure and volume signals as detected using the PV Loop LabChart Module. The pressure signal changes when the catheter is positioned in the LV. The arterial pressure signal (top) fluctuated from 80 to 120 mm Hg. Once the catheter was placed in the left ventricle, the shape of the pressure signal changes and the pressure fluctuated from 0 to 120 mm Hg. Please click here to view a larger version of this figure.
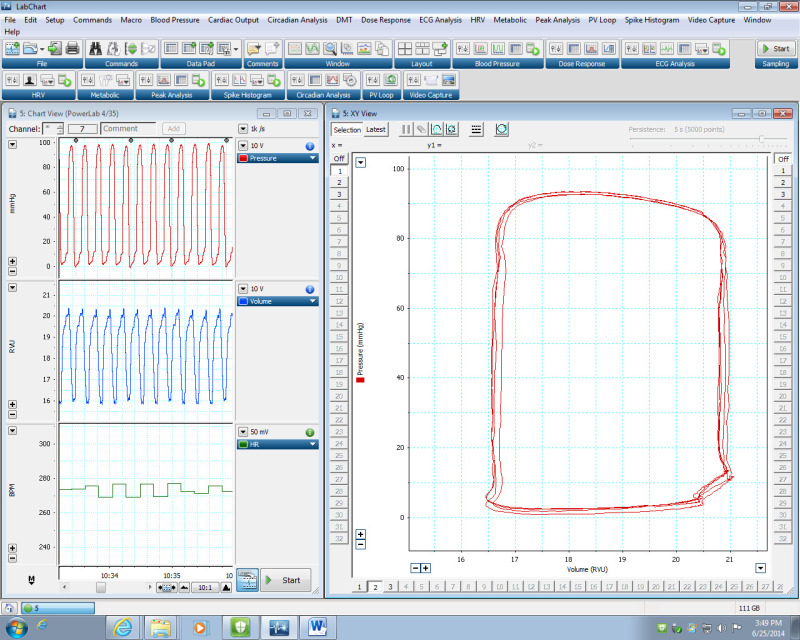 Figure 2:Generation of PV loops using the PV Loop LabChart Module. LEFT) Representative data of pressure (top), volume (middle) and heart rate (bottom). These LV pressure/volume values are used to generate the PV loop by plotting pressure (P) against volume (V). (Right) Illustration of loops generated by the data on the left. Please click here to view a larger version of this figure.
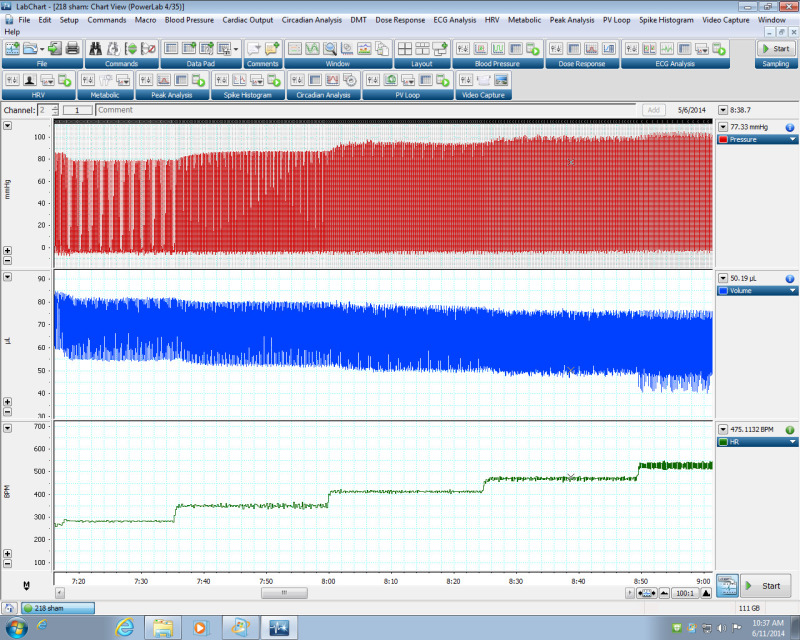 Figure 3:Effect of heart rate on LV pressure and volume. Representative data demonstrating LV pressure and volume changes with increasing heart rate using the PV Loop LabChart Module. Please click here to view a larger version of this figure.
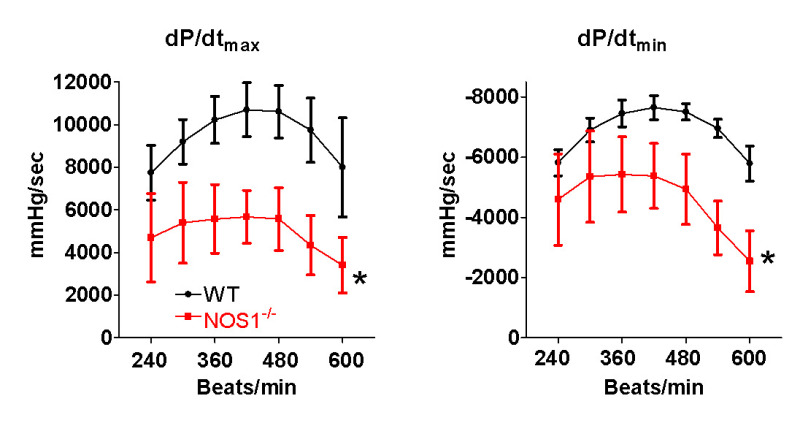 Figure 4: NOS1 knockout (NOS1-/-) mice have decreased in vivo heart function and contractile reserve. Compared to wildtype (WT) mice, NOS1-/- mice have significantly lower maximum (dP/dtmax) and minimum (dP/dtmin) rate of pressure development with increasing heart rate. Data are presented as mean ± SD. * P <0.05 vs WT via ANOVA, n = 5 mice/group.
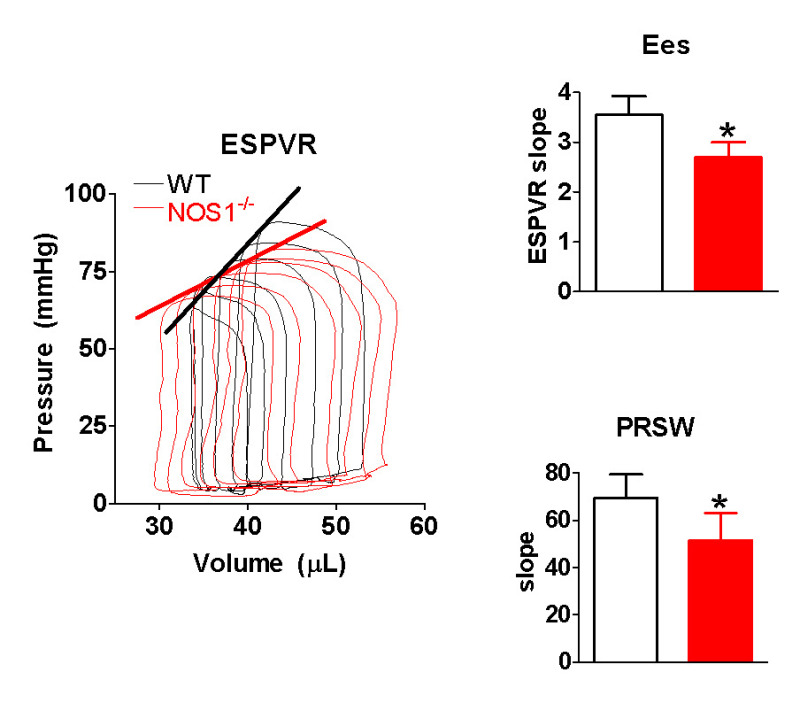 Figure 5: NOS1 knockout (NOS1-/-) mice have decreased contractility. LEFT) representative pressure/volume loops obtained during inferior vena cava occlusion. Note the proper shape of each loop. The thick lines are the end systolic pressure volume relationship (ESPVR). RIGHT) Compared to wildtype (WT) mice, NOS1-/- mice have a decreased end systolic elastance (Ees) and preload recruitable stroke work (PRSW). Data are presented as mean ± SD. * P <0.05 vs WT via unpaired t-test, n = 5 mice/group.
Discussion
A critical step for this technique to obtain a reliable measure of contractility is proper catheter placement into the LV. If the catheter is not placed correctly, when the LV contracts the walls may contact the catheter resulting in very high, and not physiological, pressure values causing irregular shaped PV loops. If needed, the catheter can be rotated to achieve the correct placement. Another key step for this technique is to make sure the mouse received proper anesthesia. If the mouse is over anesthetized, this will greatly decrease heart function. A mouse with a heart rate less than ~250 beats/min can be considered over anesthetized. Additionally, the volume of blood that the mouse heart pumps is small making it difficult to get accurate volumes. It is important to calibrate the volume for each mouse. For volume calibration, we described the cuvette calibration technique. There are additional methods that are also used to calibrate volumes (i.e., stroke volume calculation using a flow probe in the descending thoracic aorta)10.
There are many limitations of using this method in the mouse; all due to its small body size. For example, this technique requires accurate microsurgical skill. Furthermore, this technique results in some blood loss, which could potentially change heart function. Massive blood loss can be avoided by advancing the catheter through the vasculature compared to other methods (e.g., puncturing the left ventricle). Here, we describe the whole procedure in detail with critical details to avoid these issues.
Pressure/volume analysis is an important approach to investigate in vivo contractility. Performing this technique in mice is significant since there are many benefits over other species (cost, genetic manipulation, etc.). Since heart rate is an important determinant of heart function1 and affected by anesthesia, we presented additional steps to ascertain that comparable heart rates are achieved to allow a valid comparison between groups. Furthermore, using this modified PV loop technique, an investigator is able to directly test the Bowditch effect. For these reasons, we describe how to perform this technique in the mouse to obtain accurate measurements of in vivo contractility at different heart rates.
Disclosures
There are no competing financial interests.
Acknowledgments
This study was supported by NIH grants HL091986 (JPD) and HL094692 (MTZ).
References
- Janssen PM. Myocardial contraction-relaxation coupling. Am J Physiol Heart Circ Physiol. 2010;299:H1741–H1749. doi: 10.1152/ajpheart.00759.2010. [DOI] [PMC free article] [PubMed] [Google Scholar]
- Roman MJ, Devereux RB. Comparison of noninvasive measures of contractility in dilated cardiomyopathy. Echocardiography. 1991;8:139–150. doi: 10.1111/j.1540-8175.1991.tb01385.x. [DOI] [PubMed] [Google Scholar]
- Hamlin RL, del Rio C. dP/dt(max)--a measure of 'baroinometry. J Pharmacol Toxicol Methods. 2012;66:63–65. doi: 10.1016/j.vascn.2012.01.001. [DOI] [PubMed] [Google Scholar]
- Feneley MP, et al. Comparison of preload recruitable stroke work, end-systolic pressure-volume and dP/dtmax-end-diastolic volume relations as indexes of left ventricular contractile performance in patients undergoing routine cardiac catheterization. J Am Coll Cardiol. 1992;19:1522–1530. doi: 10.1016/0735-1097(92)90613-r. [DOI] [PubMed] [Google Scholar]
- Kass DA, et al. Comparative influence of load versus inotropic states on indexes of ventricular contractility: experimental and theoretical analysis based on pressure-volume relationships. Circulation. 1987;76:1422–1436. doi: 10.1161/01.cir.76.6.1422. [DOI] [PubMed] [Google Scholar]
- Nemoto S, DeFreitas G, Mann DL, Carabello BA. Effects of changes in left ventricular contractility on indexes of contractility in mice. Am J Physiol Heart Circ Physiol. 2002;283:H2504–H2510. doi: 10.1152/ajpheart.0765.2001. [DOI] [PubMed] [Google Scholar]
- Ziolo MT, Kohr MJ, Wang H. Nitric oxide signaling and the regulation of myocardial function. J Mol Cell Cardiol. 2008;45:625–632. doi: 10.1016/j.yjmcc.2008.07.015. [DOI] [PMC free article] [PubMed] [Google Scholar]
- Barouch LA, et al. Nitric oxide regulates the heart by spatial confinement of nitric oxide synthase isoforms. Nature. 2002;416:337–339. doi: 10.1038/416337a. [DOI] [PubMed] [Google Scholar]
- Wang H, et al. Neuronal nitric oxide synthase signaling within cardiac myocytes targets phospholamban. Am J Physiol Cell Physiol. 2008;294:C1566–C1575. doi: 10.1152/ajpcell.00367.2007. [DOI] [PMC free article] [PubMed] [Google Scholar]
- Georgakopoulos D, et al. In vivo murine left ventricular pressure-volume relations by miniaturized conductance micromanometry. Am J Physiol. 1998;274:H1416–H1422. doi: 10.1152/ajpheart.1998.274.4.H1416. [DOI] [PubMed] [Google Scholar]


