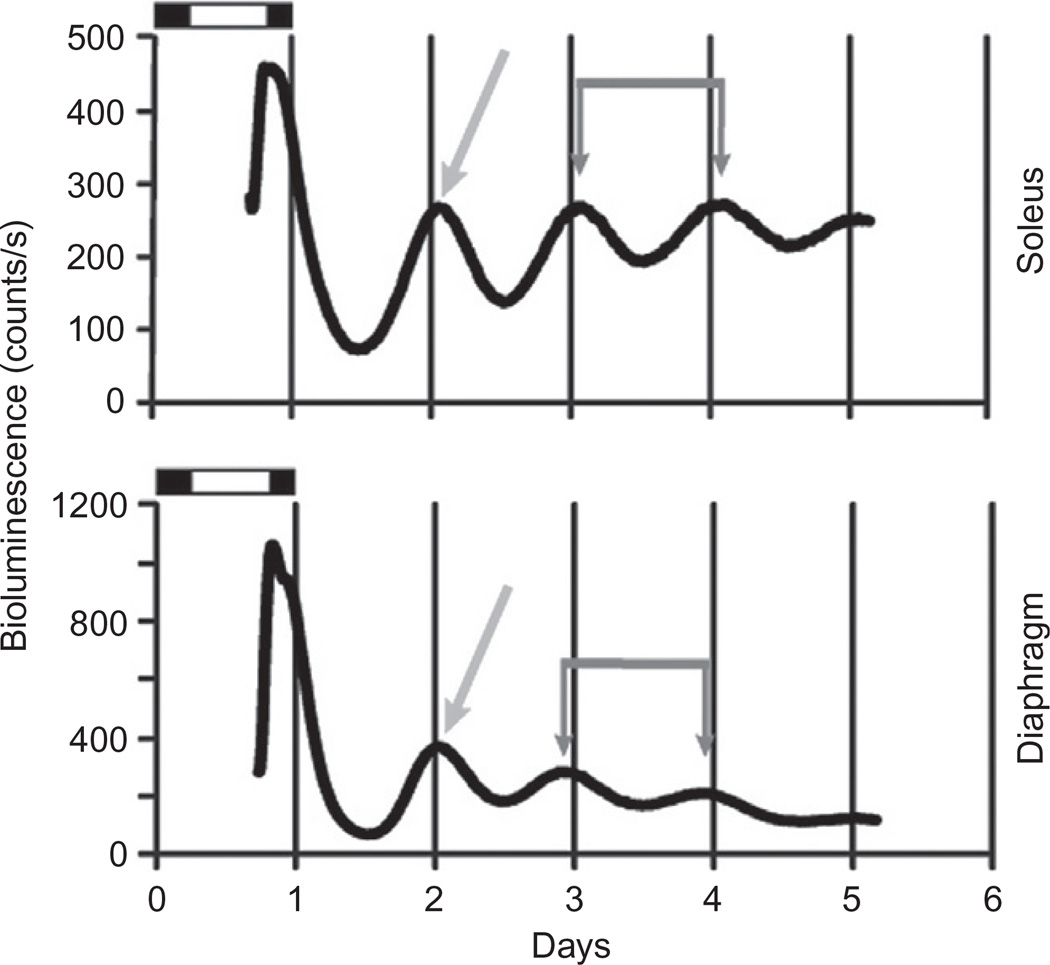
Figure 9.1.
Real-time bioluminescence data from soleus and diaphragm explants using PERIOD2::LUCIFERASE mice demonstrate that different muscles within the same animal are in phase. Soleus muscle (top) and diaphragm (bottom); bioluminescence on the y-axis measured in (photon) counts/second for 5 days (days on x-axis). Dark gray double arrows indicate peak bioluminescence on days 3 and 4 for each muscle; the time between these arrows represents the period length and is 23.92 ± 0.01 (avg ± Sd dev). The lighter gray single arrows point to the first peak following 24 h in culture; this peak reflects the phase of the molecular clock and for these samples = 24.10 ± 0.80 for the soleus muscle and 23.43 ± 0.65 for the diaphragm. (Wolff and Esser, unpublished data).

