
Figure 3.
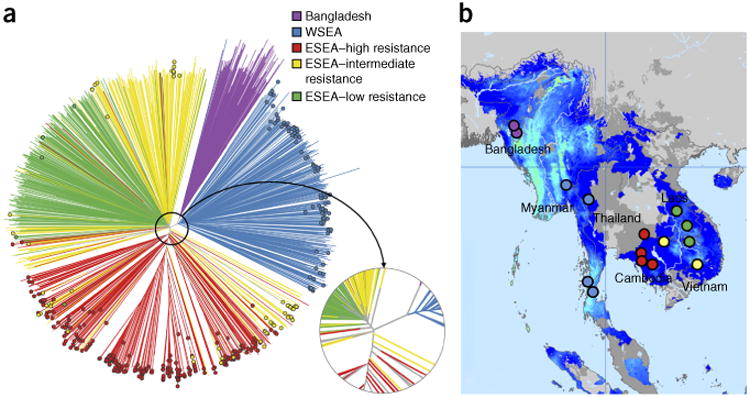
Population structure and distribution of kelch13 mutants in Southeast Asia. (a) Neighbor-joining tree showing population structure across the 15 Asian sampling sites. Branches with colored tip symbols indicate that the samples are kelch13 mutants, whereas those without tip symbols are wild type for kelch13. The circular subpanel shows a magnified view of the major branching points near the tree root. Mixed-infection samples (with a mixture of wild-type and mutant parasites) were omitted. (b) Map of the 15 sites showing the geographical location of samples in the tree. Bangladeshi (purple) and Thailand-Myanmar border region (WSEA; blue) samples form separate branches, whereas the lower Mekong region (ESEA) samples divide into two major groups, separating samples in high-resistance areas (red) from those in low-resistance areas (green); parasites in intermediate-resistance areas (yellow) are split between these two groups. Map colors indicate the endemicity of P. falciparum in 2010: light blue, high; darker blue, low; gray, absent (the map was adapted from http://www.map.ox.ac.uk/)34.