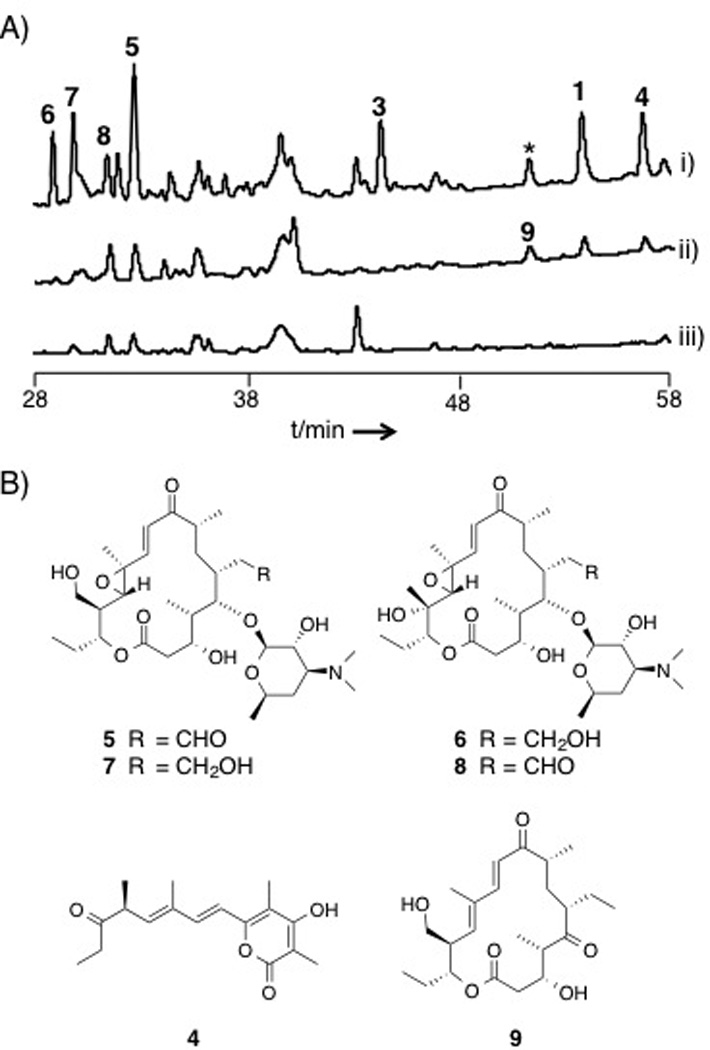
Figure 1.

(A) HPLC chromatograms of the metabolites from i) CNS-237 wild-type, ii) spr10Y1290F, and iii) Δspr cultured in A1FeBC medium. The traces represent chromatograms acquired by detection at 254 nm. (* indicates the compound whose MS and UV spectrum are identical to 1.) Though 9 is eluted at the same RT as the compound marked with an asterisk, the peak of 9 is detected at 280 nm only in the Y1290F strain (Figure S2). (B) Chemical structures of 4–9.
