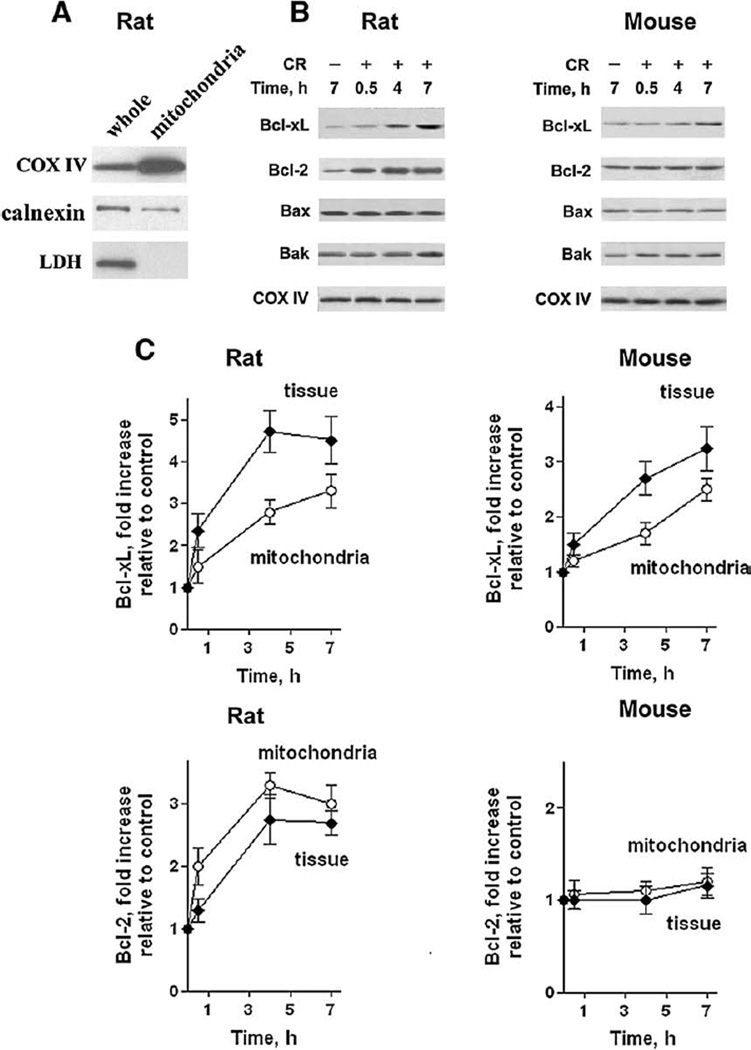
Fig. 3.
Mitochondrial levels of Bcl-xL and Bcl-2 increase during cerulein pancreatitis in parallel with their total levels in pancreas. (A) Characterization of the preparation of isolated rat pancreatic mitochondria was performed by measuring mitochondrial marker COX IV, endoplasmic reticulum marker calnexin, and cytosolic marker lactate dehydrogenase (LDH) in whole tissue homogenate (whole) and isolated mitochondria (mitochondria) by Western blot analysis. (B, C) Cerulein (CR) pancreatitis was induced in rats and mice as described in Materials and methods. Animals were sacrificed at indicated times. The levels of the various Bcl-2 proteins were measured by Western blot analysis in mitochondria isolated from pancreas of control and pancreatitic animals at indicated times after the induction of pancreatitis. Blots were re-probed for the mitochondrial marker COX IV to confirm equal protein loading. (C) The intensities of Bcl-xL and Bcl-2 bands on mitochondria immunoblots were quantified by densitometry and normalized to that of COX IV (loading control) in the same sample. The mean ratio of Bcl-xL/COX IV (or Bcl-2/COX IV) intensities in mitochondria from animals with pancreatitis was further normalized to that in control group at the same time point. The quantification of Bcl-xL and Bcl-2 protein levels in the whole pancreatic tissue was done as described in Fig. 1B. Values are means ±SE from at least 3 animals per group.

