
Figure 1. Tet1-deficiency drives B cell malignancy upon advanced age.
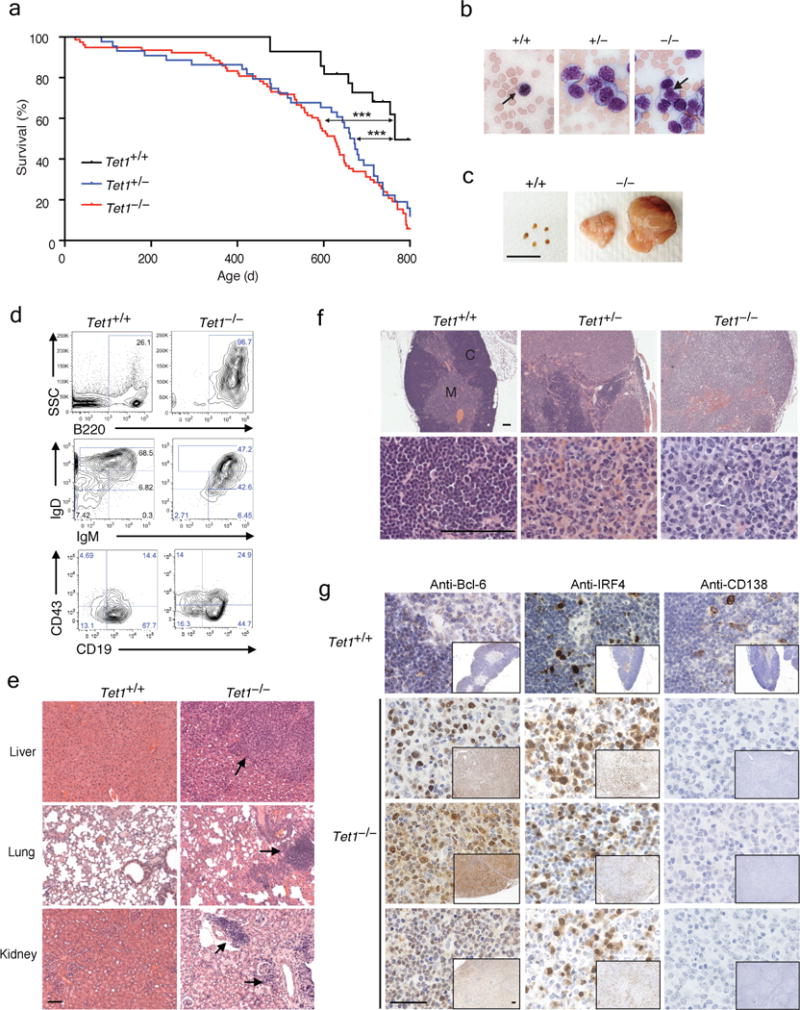
a) Kaplan-Meier survival curve of Tet1-deficient mice with heterozygous (Tet1+/−, n = 44) and homozygous (Tet1−/−, n = 78) deletion compared to wild-type mice (Tet1+/+ n = 28). * P = <0.0005. b) Peripheral blood smears stained with Wright-Giemsa; arrows indicate normal lymphocyte (left panel) and aberrant lymphocyte (right panel). Representative of n = 8–10 mice per genotype. c) Lymph nodes from Tet1+/+ and Tet1−/− mice; representative of n = 8–10 mice per genotype. Scale bar = 1cm. d). Flow cytometric analysis of malignant cells in the lymph nodes of moribund Tet1−/− compared to age-matched Tet1+/+ mice. Upper panels; side-scatter (SSC) vs. B cells (B220+). Middle Panels; B220+ gated cells stained for progenitor/precursor B cells (IgM−IgD−), immature B cells (IgM+IgD−), transitional B cells (IgM+IgDlow) and mature B cells (IgM+IgDhigh). Lower panels; B220+ gated cells stained for progenitor B cell marker CD43 vs. CD19 staining. Data are representative of 3 independent experiments, n = 8–10 mice per genotype. Histological analysis by H&E staining of e) liver, lung, kidney and f) lymph node sections from sick Tet1+/− and Tet1−/− mice compared to Tet1+/+ controls. Arrows indicate infiltration of lymphocytes. C = cortex, M = Medulla; Scale bar = 100 μm in all panels g) Immunohistochemistry of lymph nodes from Tet1+/+ and sick Tet1−/− mice stained with anti-Bcl-6, anti-IRF4, anti-CD138 antibodies (brown) and hematoxylin. Scale bar = 100 μm in all panels. Data are representative of n = 4 mice per genotype.