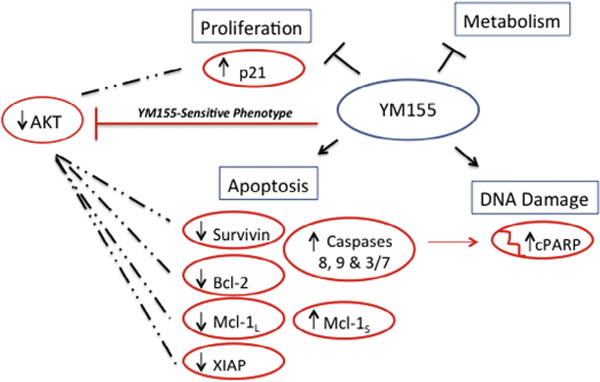
Fig. 8.

Schematic diagram of 4 major cellular pathways targeted by YM155 treatment in tumor cells [10]. Red molecules were shown to be differentially affected by YM155 exposure in this study, and represent the changes observed in YM155-sensitive HL60 cells (↑ = up-regulation; ↓ = down-regulation). Dashed lines represent a hypothetical mechanism by which constitutive AKT signaling in U937 cells may help protect specific YM155 targets [27,28,40–42] resulting in a treatment resistant phenotype. (For interpretation of the references to color in this figure legend, the reader is referred to the web version of this article.)
