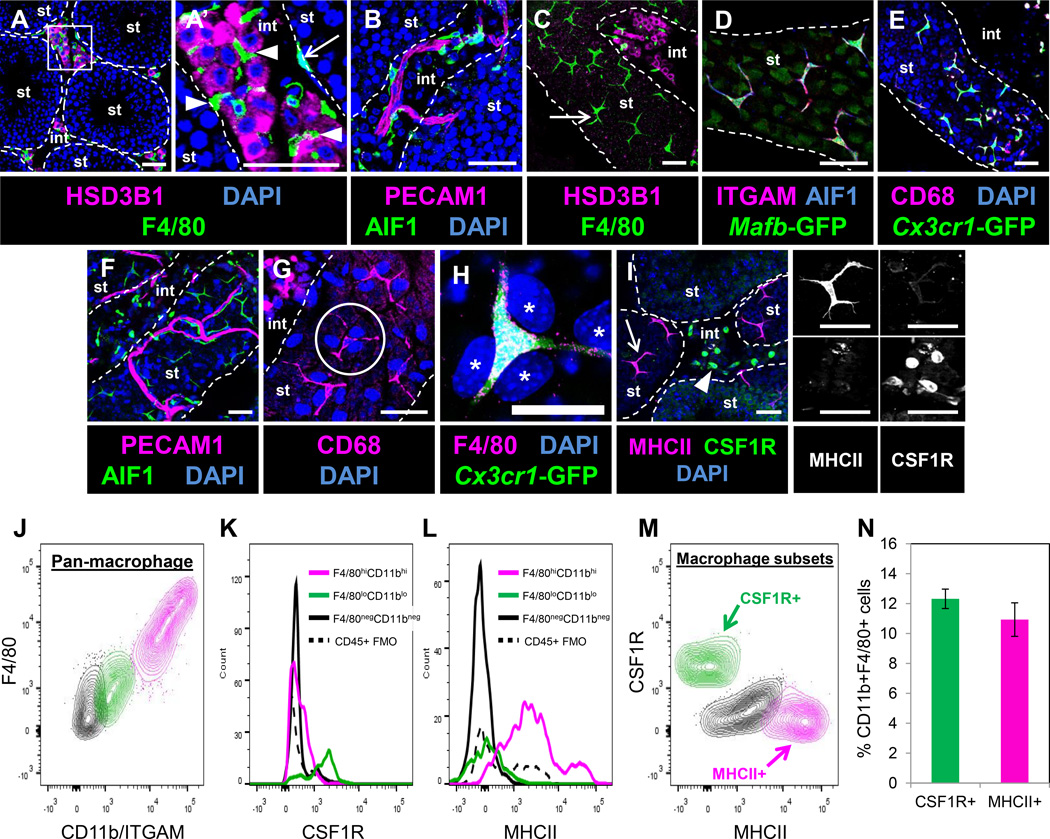
Figure 1. Adult testis macrophages are localized near Leydig cells, vasculature, and within the peritubular myoid cell layer.
A’ is a higher magnification of the boxed region in A. Dashed lines indicate outline of seminiferous tubules (“st”) throughout all figures; “int” refers to interstitium throughout all figures. (A, A’) Macrophages (arrowheads in A’) were observed within clusters of HSD3B1-positive Leydig cells and overlying seminiferous tubule surfaces (arrow in A’). (B) Macrophages were associated with interstitial vasculature (marked with PECAM1). Peritubular cells (C, arrow) were positive for macrophage markers F4/80, ITGAM (CD11b), AIF1, Mafb-GFP, CD68, and Cx3cr1-GFP (C–E). Macrophages were in close proximity to tubular vasculature (F), and made rosette-like structures (G, circle outline) with tubule surface PMCs (large nuclei, asterisks in H). Peritubular (I, arrow) and interstitial (I, arrowhead) macrophages showed opposite expression patterns for MHCII and CSF1R. Black-and-white panels to the right of I are MHCII-only and CSF1R–only images for macrophages denoted in I. Thin scale bar, 50 µm; thick scale bar, 25 µm. Panels A and I are images from cryosectioned testes; remaining images are from whole-mount seminiferous tubules. Image in I is from a superficial cryosection that contains peritubular macrophages overlying tubules (i.e., macrophages may appear to be but are not actually inside tubules); vasculature in B and F is overlying the tubule and is not within the tubule itself. (J) Flow cytometry of CD45+ cells from adult testis. Two populations of F4/80+CD11b/ITGAM+ macrophages (green and pink) are observed (black population represents CD45+ non-macrophage cell types). Histograms show differential expression of CSF1R (K) and MHCII (L) in corresponding color-coded populations from J; solid black lines in K and L represent CD45+ non-macrophage cells and dashed black lines in K and L represent fluorescence minus one (FMO) controls for total CD45+ cells. Contour plot in M shows CSF1R and MHCII expression in macrophage populations; black population represents double-negative population. Plots in J-M are representative experiments of four separate testes from two different CD-1 mice. Graph in N shows CSF1R+ and MHCII+ cells as a percent of total macrophages; gating is based on corresponding FMO control. Data in N are shown as mean ± SEM. See also Figures S1 and S2 and Movies S1 and S2.

