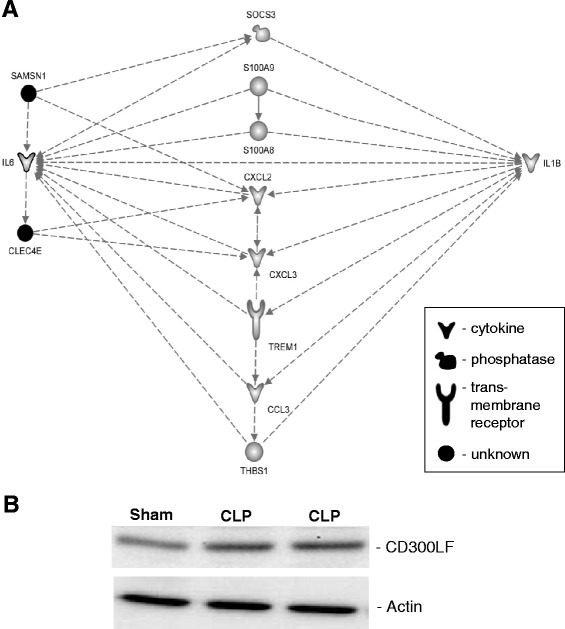
Fig. 3.

In silico and in vitro validation of Clec4e and Cd300lf gene candidates. Panel a: The top gene network generated by IPA for 42 ARDS gene candidates. This network was reduced to genes that posses at least three established connections to members of the network. Relationships between genes are represented by solid lines (binding), solid arrows (direct activation), or broken arrows (indirect activation). Arrows point to the element on which an action is performed. Black molecules represent new candidate genes. Grey molecules represent significant ARDS genes. Panel b: The Western blot analysis of Cd300lf protein expression. Each lane contains 20 μg of lung tissue lysate. The top bands represent signals of Cd300lf protein in the sham and two CLP challenged mice. The bottom bands represent signals of actin, which was used as a loading control
