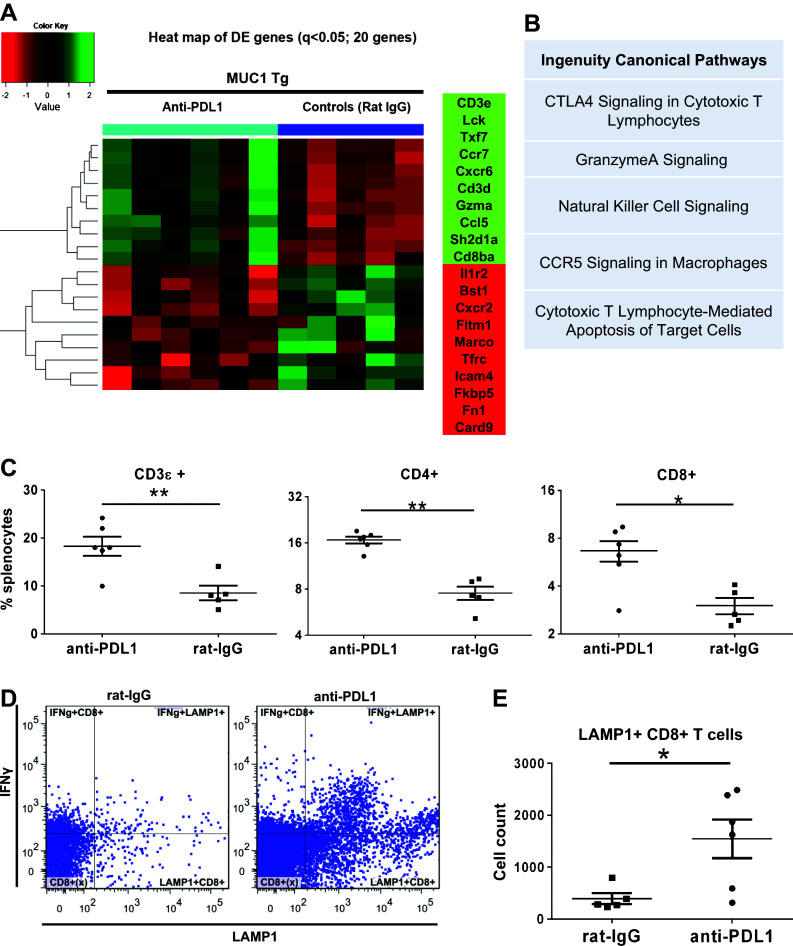
Fig. 2.

Treatment-induced changes in splenocyte T cell populations and immune gene expression profiles. a Heat map of top 20 DE genes (adjusted q < 0.05) in splenocytes of MUC1.Tg mice that received anti-PD-L1 or rat IgG (controls), detected via Nanostring. b Top five canonical pathways identified by IPA, using n = 79 DE genes. c Phenotypic analysis via flow multicolor cytometry of splenocytes from mice treated with either anti-PD-L1 or control rat IgG. Percent cells positive for CD3 (left), CD4 (middle) and CD8 (right) are shown. d Flow cytometry dot plots showing intracellular staining for IFNγ and LAMP1 following ex vivo stimulation of whole splenocytes in anti-CD3-coated 96 well plates. Data shown are from one representative mouse from either the isotype control (left) or anti-PD-L1 treatment group (right). e Total counts for CD8+ T cells expressing the degranulation marker LAMP1 (CD107a) from n = 5 control-treated and n = 6 anti-PD-L1-treated mice. *p < 0.05; **p < 0.001, Mann–Whitney t test
