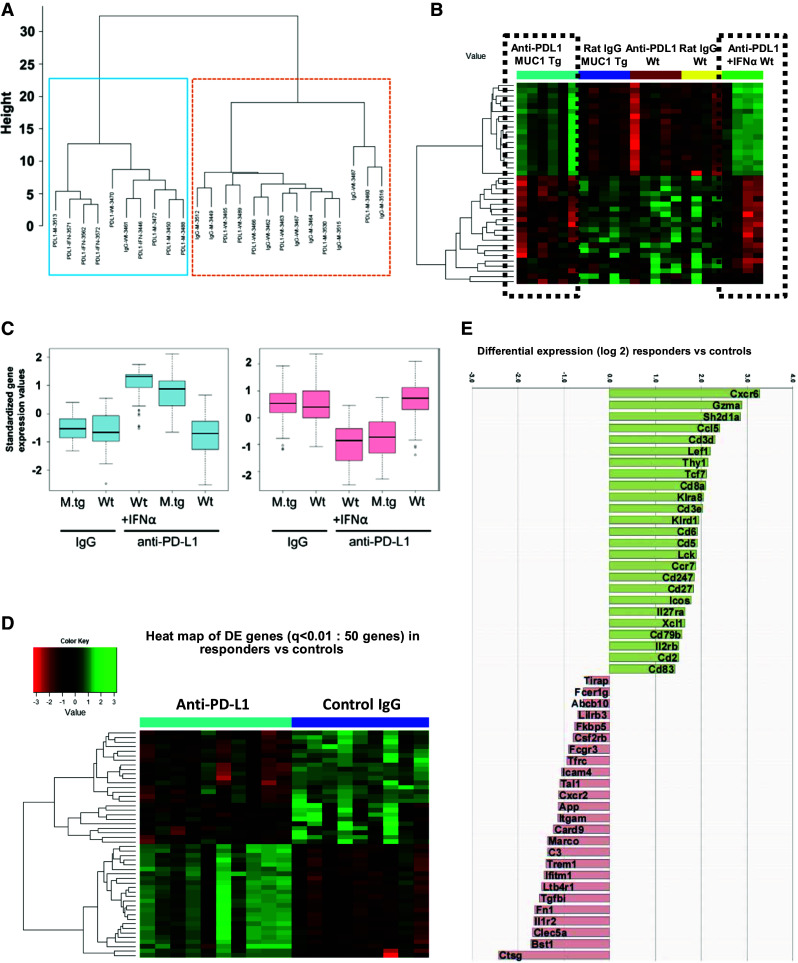
Fig. 5.

Identification of genes associated with anti-PD-L1-induced increase in survival. a Unsupervised cluster analysis using gene expression of n = 357 filtered genes, from five mouse groups (n = 24): MUC1.Tg mice (n = 11, of which six received anti-PD-L1 and 5 were controls) and wild-type mice (n = 13, of which five received low-dose anti-PD-L1 with no survival benefit, four received dose-dense anti-PD/L1/IFNα with increased survival and four were IgG controls). Two major clusters are observed of 10 (left, blue box) and 14 mice (right, orange box), respectively. b Heat map of the top 39 DE genes, from five mouse group comparisons (ANOVA, p < 0.025). Two clusters of genes (of 18 and 21 genes, respectively) show similar patterns in the anti-PD-L1 groups with increased survival (black dotted boxes), in contrast to the three other groups with no survival benefit, which also share a similar pattern. c Gene expressions of the two clusters, stratified by groups. Y axis is the standardized expression values for the genes in the cluster. Boxplots show that the anti-PD-L1 groups have clearly higher expression than the other groups in the first cluster but lower expression in the second cluster. d Heat map of top 50 DE genes (q < 0.01) from the comparison of anti-PD-L1-treated mice with increased survival (n = 10 mice, of which n = 6 MUC1.Tg mice treated with anti-PD-L1 and n = 4 WT mice treated with dose-intense anti-PD-L1/IFNα) versus isotype control-treated mice (non-responders, n = 9 mice). e Graph bars of the top 50 DE genes shown in panel D heat map (q < 0.01). Values plotted represent average differential gene expression (log2). Positive values represent upregulated and negative values represent downregulated genes in anti-PD-L1-treated mice compared to controls
