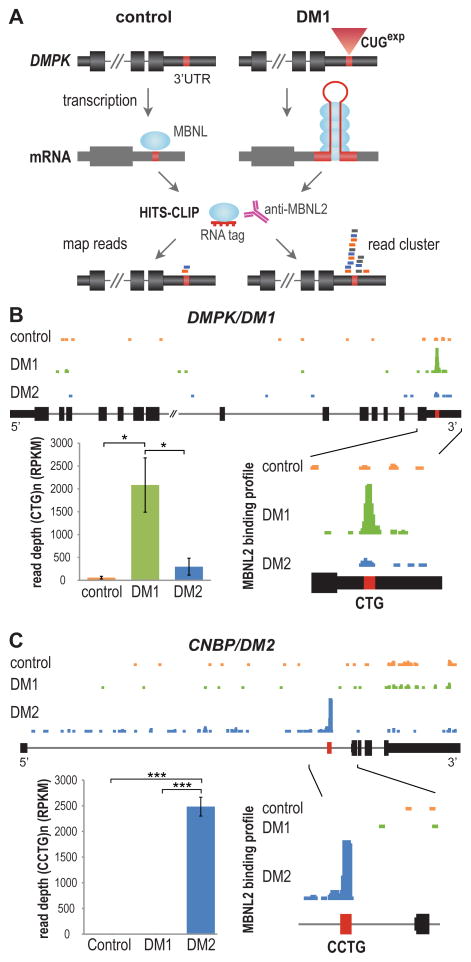
Figure 1. HITS-CLIP Identifies MBNL2-RNAexp Interactions in DM Brain.
(A) Strategy for identifying RBP-RNAexp binding interactions using HITS-CLIP. For DM1, a CTG repeat (red box) in the DMPK 3′UTR (coding exons, thick black boxes; UTRs, thin black boxes; introns, thin lines) expands in disease (CUGexp, red triangle). Upon transcription, the mRNA (grey) forms a stem-loop that sequesters MBNL2 (blue ovals). HITS-CLIP of MBNL proteins using DM1 (right), but not control (left), tissue generates a large increase in reads clustered over the repeat region (bottom right).
(B) MBNL2 binding profile reveals enriched binding to the DMPK CTGexp in DM1 brain. UCSC browser view showing wiggle plots of MBNL2 HITS-CLIP binding in the DMPK reference gene for control (orange), DM1 (green), and DM2 (blue) human hippocampus. Zoomed-in view of the terminal exon (bottom right) showing a clustered read peak over the CTG repeat region for DM1 only. Quantification (bottom left) of MBNL2 CLIP peak read depth (RPKM) over the DMPK CTG repeat region shows a significant enrichment (36-fold) over controls (n = 3 per group, data are reported ± SEM, *p < 0.05).
(C) MBNL2 HITS-CLIP binding profile for CNBP. Intron 1 (bottom right) containing the CCTG repeat region (red box) is shown. Quantification (bottom left) of average peak read depth over CCTG repeats showing a 79-fold enrichment in DM2 over controls (n = 3 per group, data are reported ± SEM, ***p < 0.001).

