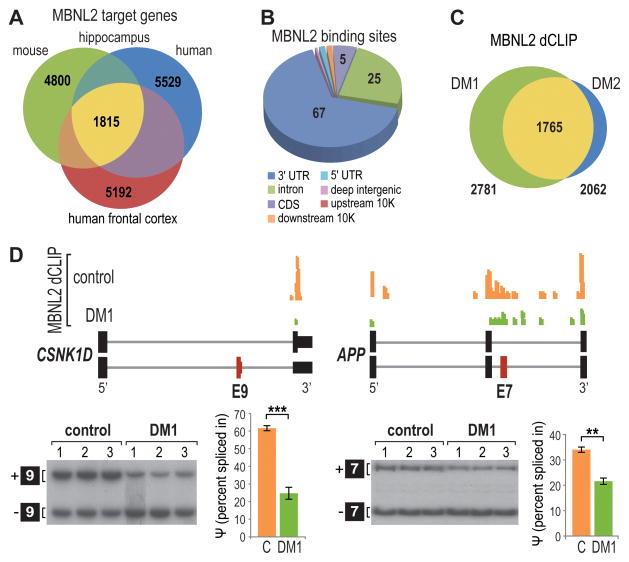
Figure 2. Depletion of MBNL2 Binding for Mis-regulated Exons in DM1.
(A) Venn diagram of overlapping MBNL2 target genes in human hippocampus and frontal cortex and mouse hippocampus.
(B) Pie chart of MBNL2 binding site distribution in human hippocampus.
(C) Venn diagram of common genes in DM1 and DM2 with MBNL2 depletion events identified by dCLIP analysis.
(D) UCSC browser view of MBNL2 dCLIP near CSNK1D exon 9 (left) (alternative exon, red box; flanking exons, thick black boxes; introns, gray lines) and APP exon 7 (right) showing loss of binding in DM1 (green) compared to controls (orange) (n = 3 each). RT-PCR splicing analyses are also shown for CSNK1D and APP in control versus DM1 brain with corresponding percent spliced in (ψ) values (n = 3 per group, data are reported ± SEM, ***p < 0.001, **p < 0.01).

