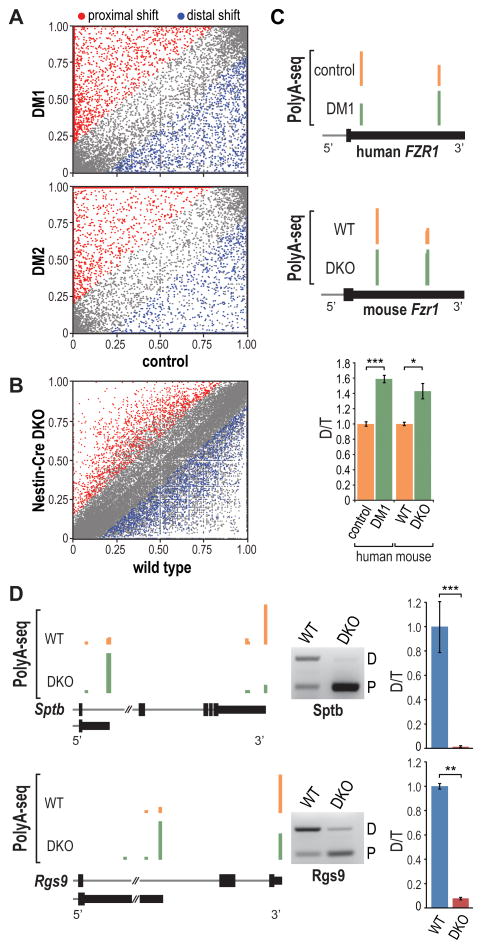
Figure 6. Disrupted Polyadenylation in Human DM and Mouse Mbnl DKO Brain.
(A) Scatter plot representation of PolyA-seq data showing APA shifts to more distal (blue) or proximal (red) pA sites relative to the coding region in DM1 (top) and DM2 (bottom) versus control brain (FDR < 0.05, |dI| > 0.15). The data represents distal (n = 2,794), proximal (3,853), total (6,647), and no shift (25,357) in DM1 and distal (2,273), proximal (3,290), total (5,563), and no shift (27,683) in DM2.
(B) Scatter plot illustrating shifts to more distal (blue) or proximal (red) pA sites in Nestin-Cre DKO versus WT brain (FDR < 0.05, |dI| > 0.15). The data represent distal (1,668), proximal (1,528), total (3,195) and no shift (47,944).
(C) PolyA-seq wiggle plots showing shifts to distal polyA sites in the FZR1 3′ UTR (3′ UTR, thin black box; coding region, thick black boxes; intron, gray line) in DM1 versus control (top) and Nestin-Cre DKO versus WT (middle). RT-PCR validation (bottom) of FZR1/Fzr1 switches (distal, D; total, T; n = 3 per group, data are reported ± SEM, *p < 0.05, ***p < 0.001).
(D) Wiggle plots (left) of PolyA-seq data for Sptb and Rgs9 comparing APA patterns in WT versus Nestin-Cre DKO brain. RT-PCR validation (middle) of APA changes with quantification (right) of distal (D) versus total (T) pA utilization (n = 3 per group, data are reported ± SEM, **p < 0.01, ***p < 0.001).

