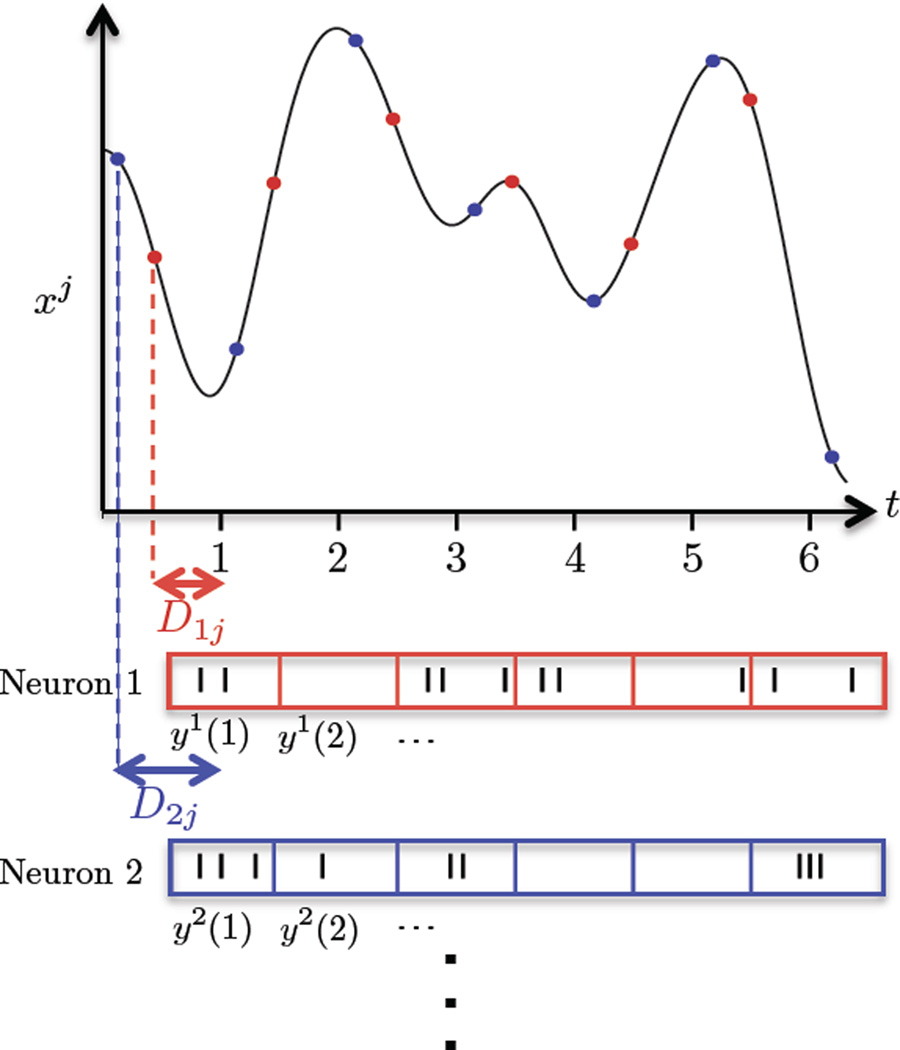
Figure 2.
Illustration of the TD-GPFA observation model. y1 and y2 are two time series observed at times t = 1 … 6. The first observed variable y1 reflects the values of the jth latent variable xj at points on a grid (red dots) shifted by D1j. The second observed variable y2 reflects the values of xj at points on a grid (blue dots) shifted by D2j, and so on. For example, y1 and y2 could be binned spike counts of neurons, with the bins centered at times t = 1 … 6.

