Figure 4.
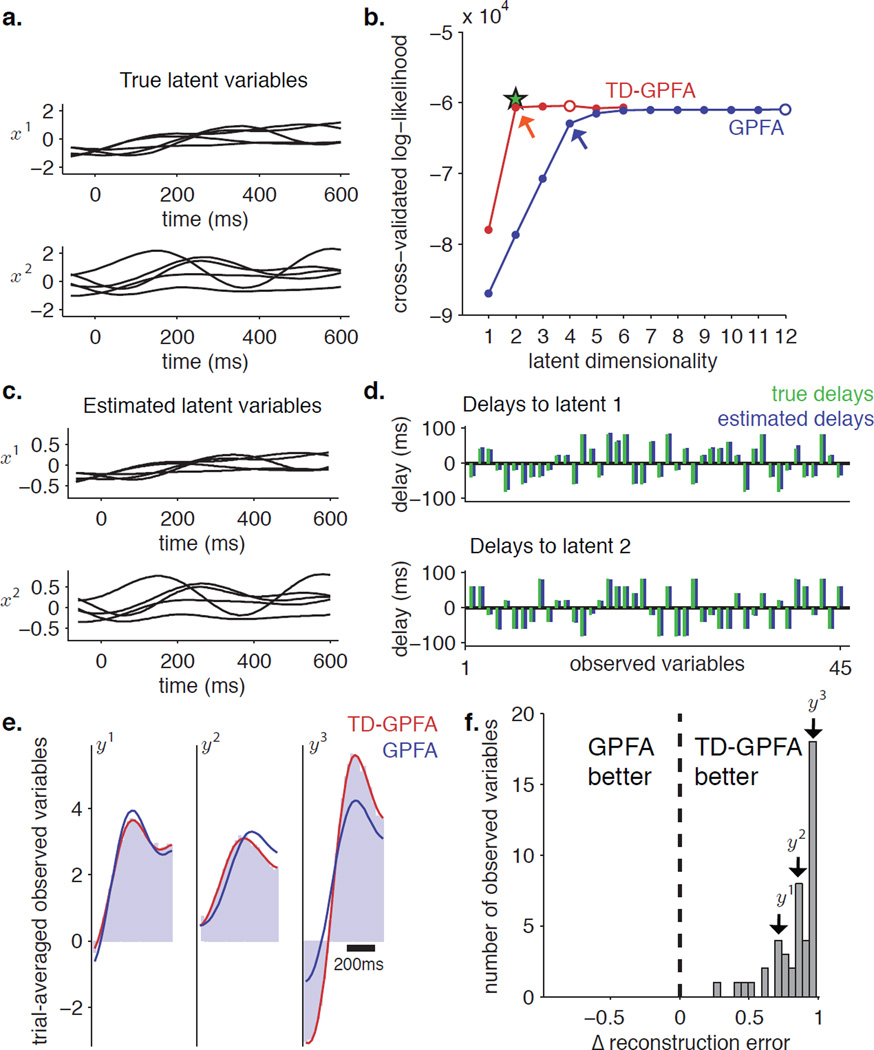
Simulation 2. a. Simulated latent variables (5 trials shown). b. Cross-validated log-likelihood (CV-LL) plots versus latent dimensionality for TD-GPFA (red) and GPFA (blue). For each curve, the open circle indicates the peak while the arrow indicates the elbow. The green star indicates CV-LL obtained by initializing ECME for TD-GPFA with ground truth parameters. c. Latent variables estimated by TD-GPFA for latent dimensionality 2 (same 5 trials as shown in panel a.). d. Ground truth (green) and estimated (blue) delays from each latent variable to all observed variables. e. Comparison of trial-averaged observed time courses for 3 representative observed variables (light blue) with those predicted by TD-GPFA (red) and GPFA (blue), with a latent dimensionality of 2. f. Histogram of the normalized difference between GPFA and TD-GPFA reconstruction errors, computed separately for each observed variable. Observed variables to the right of 0 are better reconstructed by TD-GPFA, while those to the left of 0 are better reconstructed by GPFA.

