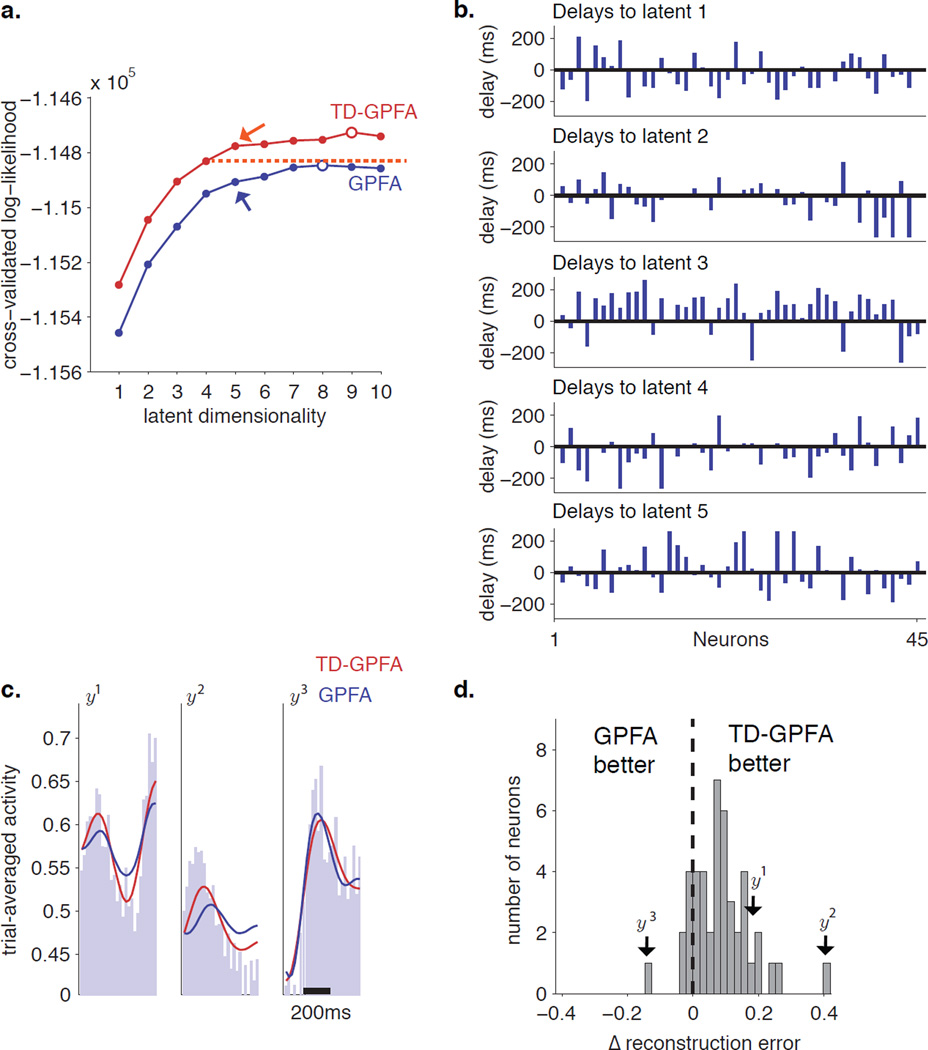
Figure 5.
TD-GPFA applied to neural activity recorded in the motor cortex. a. Cross-validated log-likelihood (CV-LL) plots versus latent dimensionality for TD-GPFA (red) and GPFA (blue). For each curve, the open circle indicates the peak while the arrow indicates the elbow. The red dotted line is the CV-LL of the TD-GPFA model with 4 latent dimensions. b. Estimated delays from each latent variable to all neurons. c. Comparison of empirical firing rate histograms (light blue) to firing rate histograms predicted by TD-GPFA (red) and GPFA (blue) for 3 representative neurons. The vertical axis has units of square-rooted spike counts taken in a 20 ms bin. Five latent variables were used for both TD-GPFA and GPFA. d. Histogram of the normalized difference between GPFA and TD-GPFA reconstruction errors, computed separately for each neuron. Neurons to the right of 0 are better reconstructed by TD-GPFA, while those to the left of 0 are better reconstructed by GPFA.

